File:Athena Code 2D hydro simulation circular wave.png
跳至導覽
跳至搜尋
預覽大小:399 × 599 像素。 其他解析度:160 × 240 像素 | 409 × 614 像素。
原始檔案 (409 × 614 像素,檔案大小:97 KB,MIME 類型:image/png)
說明
說明
添加單行說明來描述出檔案所代表的內容
摘要
[編輯]
| 描述 |
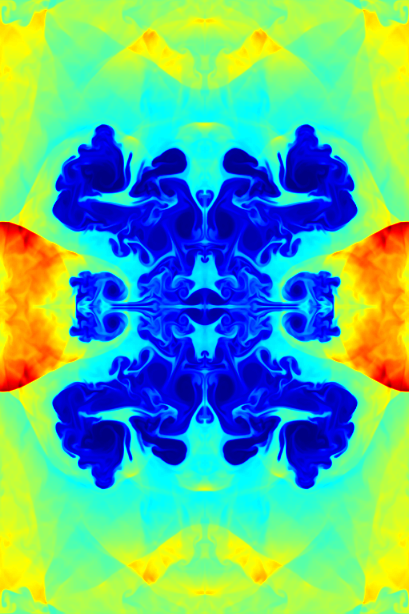
English: Two-dimensional simulation done by Athena3D software. 2D simulations on a grid of Nx = 512 and Ny = 768. Plotted linear density maps (higher values are redder). Frame from simulation at time 3.75 with density ranging from 0.1 to 2.2. One can see the Richtmyer-Meshkov instability has produced a complex pattern of "fingers".
Polski: Dwuwymiarowa symulacja wykonana oprogramowaniem Athena 3D. Symulacja 2D z siatką Nx = 512, Ny = 768. Przedstawia liniowo gęstość (im większa wartość, tym czerwieńszy kolor). Kadr animacji; czas: 3,75; gęstości od 0,1 do 2,1. Widać tworzącą się niestabilność Richtmeyera-Meszkowa, składającą się ze złożonego wzoru "palców". |
| 來源 | http://www.astro.virginia.edu/VITA/ATHENA/blast.html |
| 作者 | James Stone, Thomas Gardiner, Peter Teuben, John Hawley, Jake Simon |
| 授權許可 (重用此檔案) |
http://www.astro.virginia.edu/VITA/athena.php |
授權條款
[編輯]

|
已授權您依據自由軟體基金會發行的無固定段落、封面文字和封底文字GNU自由文件授權條款1.2版或任意後續版本,對本檔進行複製、傳播和/或修改。該協議的副本列在GNU自由文件授權條款中。 |
原始上傳日誌
[編輯]
| 日期/時間 | 尺寸 | 用戶 | 備註 |
|---|---|---|---|
| 2010年五月5日, 19:52:38 | 409 × 614 (170283 bytes) | NH2501 (對話 · 貢獻) | {{Information |Description={{en|1=Two-dimensional simulation done by Athena3D software. 2D simulations on a grid of Nx = 512 and Ny = 768. Plotted linear density maps (higher values are redder). One can see the Richtmyer-Meshkov instability has produced |
檔案歷史
點選日期/時間以檢視該時間的檔案版本。
| 日期/時間 | 縮圖 | 尺寸 | 用戶 | 備註 | |
|---|---|---|---|---|---|
| 目前 | 2014年8月18日 (一) 15:16 | | 409 × 614(97 KB) | GifTagger(對話 | 貢獻) | Bot: Converting file to superior PNG file. (Source: Athena_Code_2D_hydro_simulation_circular_wave.gif). This GIF was problematic due to non-greyscale color table. |
無法覆蓋此檔案。
檔案用途
下列頁面有用到此檔案:
全域檔案使用狀況
以下其他 wiki 使用了這個檔案:
- pl.wikinews.org 的使用狀況
- zh.wikipedia.org 的使用狀況