File:Binary Boiling Point Diagram new.svg
跳至導覽
跳至搜尋

此 SVG 檔案的 PNG 預覽的大小:391 × 378 像素。 其他解析度:248 × 240 像素 | 497 × 480 像素 | 794 × 768 像素 | 1,059 × 1,024 像素 | 2,118 × 2,048 像素。
原始檔案 (SVG 檔案,表面大小:391 × 378 像素,檔案大小:23 KB)
說明
說明
添加單行說明來描述出檔案所代表的內容
| 描述 |
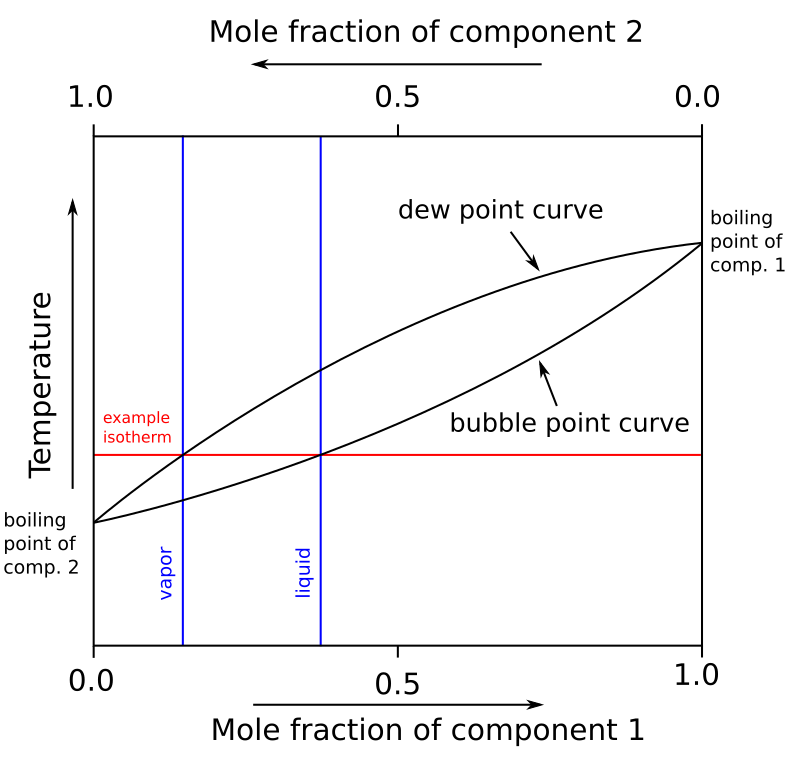
English: Binary Boiling Point Diagram (graph) of a hypothetical mixture of two components without an azeotrope. An example isotherm line is shown to compare vapor and liquid compositions at that temperature.
Русский: График температур кипения некоторой смеси двух не образующих азеотропную смесь компонентов. Приведён пример линии изотермы для сравнения составов пара и жидкости при этой температуре. |
| 日期 | (UTC) |
| 來源 | |
| 作者 |
|
| 其他版本 |
[]
.png:
Derivative works of this file: |


| 這是一張修飾過的圖片,即本圖片是用軟體修改過後的版本,修改的方式或內容有:vectorized。原版圖片來源:Binary Boiling Point Diagram.PNG。修改者:Michbich。
|
我,本作品的著作權持有者,決定用以下授權條款發佈本作品:
此檔案採用創用CC 姓名標示-相同方式分享 2.5 通用版授權條款。
- 您可以自由:
- 分享 – 複製、發佈和傳播本作品
- 重新修改 – 創作演繹作品
- 惟需遵照下列條件:
- 姓名標示 – 您必須指名出正確的製作者,和提供授權條款的連結,以及表示是否有對內容上做出變更。您可以用任何合理的方式來行動,但不得以任何方式表明授權條款是對您許可或是由您所使用。
- 相同方式分享 – 如果您利用本素材進行再混合、轉換或創作,您必須基於如同原先的相同或兼容的條款,來分布您的貢獻成品。
原始上傳日誌
[編輯]
This image is a derivative work of the following images:
- File:Binary_Boiling_Point_Diagram.PNG licensed with Cc-by-sa-2.5
- 2007-03-18T22:36:14Z H Padleckas 380x370 (5721 Bytes) revised previous diagram slightly adding lines to show X2 composition
- 2007-01-25T02:09:10Z Pngbot 380x370 (3006 Bytes) optimized with optipng
- 2006-11-21T17:01:03Z H Padleckas 380x370 (8980 Bytes) Binary Boiling Point Diagram
Uploaded with derivativeFX
檔案歷史
點選日期/時間以檢視該時間的檔案版本。
| 日期/時間 | 縮圖 | 尺寸 | 用戶 | 備註 | |
|---|---|---|---|---|---|
| 目前 | 2020年11月18日 (三) 09:33 | | 391 × 378(23 KB) | Hugo(對話 | 貢獻) | File uploaded using svgtranslate tool (https://svgtranslate.toolforge.org/). Added translation for cs. |
| 2009年11月10日 (二) 10:00 |  | 391 × 378(20 KB) | Michbich(對話 | 貢獻) | once more | |
| 2009年11月10日 (二) 09:58 |  | 391 × 378(20 KB) | Michbich(對話 | 貢獻) | tried fixing the fonts | |
| 2009年11月10日 (二) 09:56 |  | 391 × 378(19 KB) | Michbich(對話 | 貢獻) | {{Information |Description={{en|Binary Boiling Point Diagram (graph) of a hypothetical mixture of two components '''without''' an azeotrope. An example isotherm line is shown to compare vapor and liquid compositions at that temperature.}} |Source=*[[:Fil |
無法覆蓋此檔案。
檔案用途
下列8個頁面有用到此檔案:
- File:Binary Boiling Point Diagram.PNG
- File:Binary Boiling Point Diagram new-ru.svg
- File:Binary Boiling Point Diagram new.svg
- File:Binäres Siedepunktsdiagramm AB.svg
- File:Binäres Siedepunktsdiagramm neu.svg
- File:Diagrama de fases binari-punt ebullició.png
- File:Diagramme binaire liquide-vapeur.svg
- Template:Other versions/Binary Boiling Point Diagram
全域檔案使用狀況
以下其他 wiki 使用了這個檔案:
- bn.wikipedia.org 的使用狀況
- el.wikipedia.org 的使用狀況
- en.wikipedia.org 的使用狀況
- es.wikipedia.org 的使用狀況
- fa.wikipedia.org 的使用狀況
- fr.wikipedia.org 的使用狀況
- id.wikipedia.org 的使用狀況
- mk.wikipedia.org 的使用狀況
- sr.wikipedia.org 的使用狀況
- te.wikipedia.org 的使用狀況
- tn.wikipedia.org 的使用狀況
- zh.wikipedia.org 的使用狀況