File:Binary Boiling Point Diagram new.svg
跳转到导航
跳转到搜索

此SVG文件的PNG预览的大小:391 × 378像素。 其他分辨率:248 × 240像素 | 497 × 480像素 | 794 × 768像素 | 1,059 × 1,024像素 | 2,118 × 2,048像素。
原始文件 (SVG文件,尺寸为391 × 378像素,文件大小:23 KB)
说明
说明
添加一行文字以描述该文件所表现的内容
| 描述 |
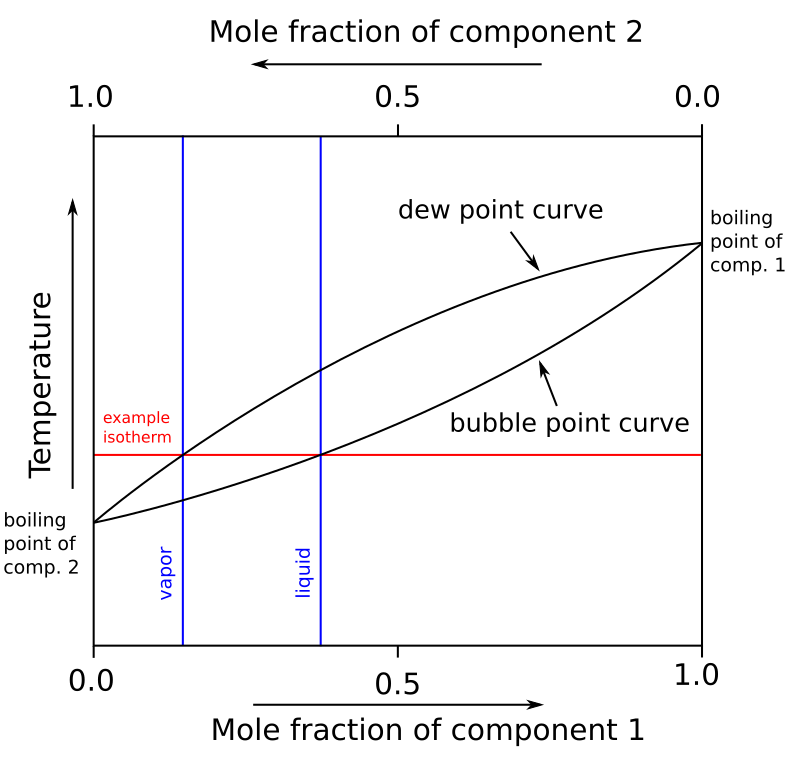
English: Binary Boiling Point Diagram (graph) of a hypothetical mixture of two components without an azeotrope. An example isotherm line is shown to compare vapor and liquid compositions at that temperature.
Русский: График температур кипения некоторой смеси двух не образующих азеотропную смесь компонентов. Приведён пример линии изотермы для сравнения составов пара и жидкости при этой температуре. |
| 日期 | (UTC) |
| 来源 | |
| 作者 |
|
| 其他版本 |
[]
.png:
Derivative works of this file: |


| 这是一张修改过的图片,这意味着它已在原版本的基础上通过软件进行了编辑,改动内容:vectorized。其原始版本为:Binary Boiling Point Diagram.PNG。修改者:Michbich。
|
我,本作品著作权人,特此采用以下许可协议发表本作品:
本文件采用知识共享署名-相同方式共享 2.5 通用许可协议授权。
- 您可以自由地:
- 共享 – 复制、发行并传播本作品
- 修改 – 改编作品
- 惟须遵守下列条件:
- 署名 – 您必须对作品进行署名,提供授权条款的链接,并说明是否对原始内容进行了更改。您可以用任何合理的方式来署名,但不得以任何方式表明许可人认可您或您的使用。
- 相同方式共享 – 如果您再混合、转换或者基于本作品进行创作,您必须以与原先许可协议相同或相兼容的许可协议分发您贡献的作品。
原始上传日志
[编辑]
This image is a derivative work of the following images:
- File:Binary_Boiling_Point_Diagram.PNG licensed with Cc-by-sa-2.5
- 2007-03-18T22:36:14Z H Padleckas 380x370 (5721 Bytes) revised previous diagram slightly adding lines to show X2 composition
- 2007-01-25T02:09:10Z Pngbot 380x370 (3006 Bytes) optimized with optipng
- 2006-11-21T17:01:03Z H Padleckas 380x370 (8980 Bytes) Binary Boiling Point Diagram
Uploaded with derivativeFX
文件历史
点击某个日期/时间查看对应时刻的文件。
| 日期/时间 | 缩略图 | 大小 | 用户 | 备注 | |
|---|---|---|---|---|---|
| 当前 | 2020年11月18日 (三) 09:33 | | 391 × 378(23 KB) | Hugo(留言 | 贡献) | File uploaded using svgtranslate tool (https://svgtranslate.toolforge.org/). Added translation for cs. |
| 2009年11月10日 (二) 10:00 |  | 391 × 378(20 KB) | Michbich(留言 | 贡献) | once more | |
| 2009年11月10日 (二) 09:58 |  | 391 × 378(20 KB) | Michbich(留言 | 贡献) | tried fixing the fonts | |
| 2009年11月10日 (二) 09:56 |  | 391 × 378(19 KB) | Michbich(留言 | 贡献) | {{Information |Description={{en|Binary Boiling Point Diagram (graph) of a hypothetical mixture of two components '''without''' an azeotrope. An example isotherm line is shown to compare vapor and liquid compositions at that temperature.}} |Source=*[[:Fil |
您不可以覆盖此文件。
文件用途
以下8个页面使用本文件:
- File:Binary Boiling Point Diagram.PNG
- File:Binary Boiling Point Diagram new-ru.svg
- File:Binary Boiling Point Diagram new.svg
- File:Binäres Siedepunktsdiagramm AB.svg
- File:Binäres Siedepunktsdiagramm neu.svg
- File:Diagrama de fases binari-punt ebullició.png
- File:Diagramme binaire liquide-vapeur.svg
- Template:Other versions/Binary Boiling Point Diagram
全域文件用途
以下其他wiki使用此文件:
- bn.wikipedia.org上的用途
- el.wikipedia.org上的用途
- en.wikipedia.org上的用途
- es.wikipedia.org上的用途
- fa.wikipedia.org上的用途
- fr.wikipedia.org上的用途
- id.wikipedia.org上的用途
- mk.wikipedia.org上的用途
- sr.wikipedia.org上的用途
- te.wikipedia.org上的用途
- th.wikipedia.org上的用途
- tn.wikipedia.org上的用途
- zh.wikipedia.org上的用途