File:Biplot of Anderson's Iris data set.svg
跳转到导航
跳转到搜索

此SVG文件的PNG预览的大小:540 × 540像素。 其他分辨率:240 × 240像素 | 480 × 480像素 | 768 × 768像素 | 1,024 × 1,024像素 | 2,048 × 2,048像素。
原始文件 (SVG文件,尺寸为540 × 540像素,文件大小:84 KB)
说明
说明
添加一行文字以描述该文件所表现的内容
摘要[编辑]
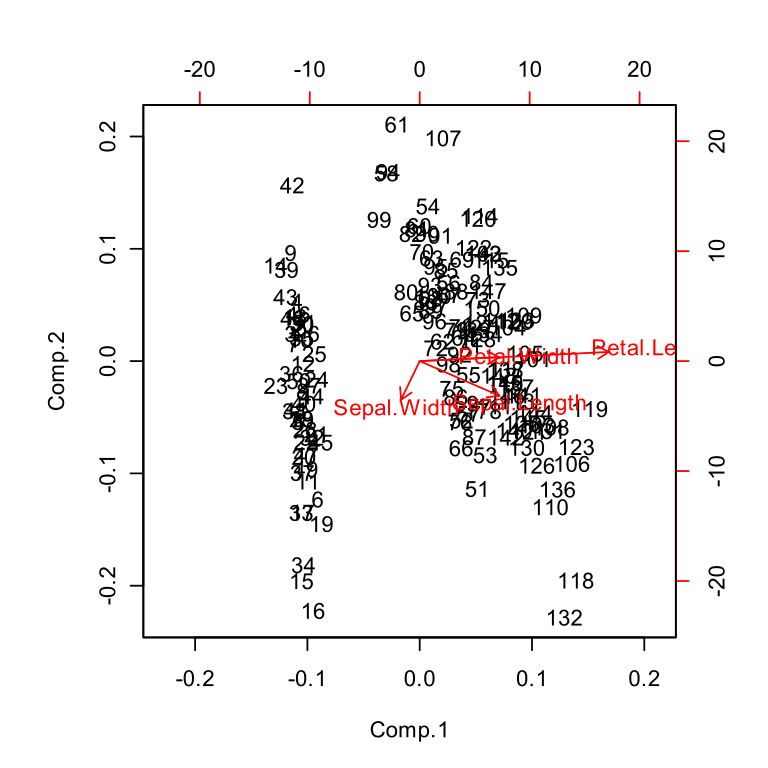
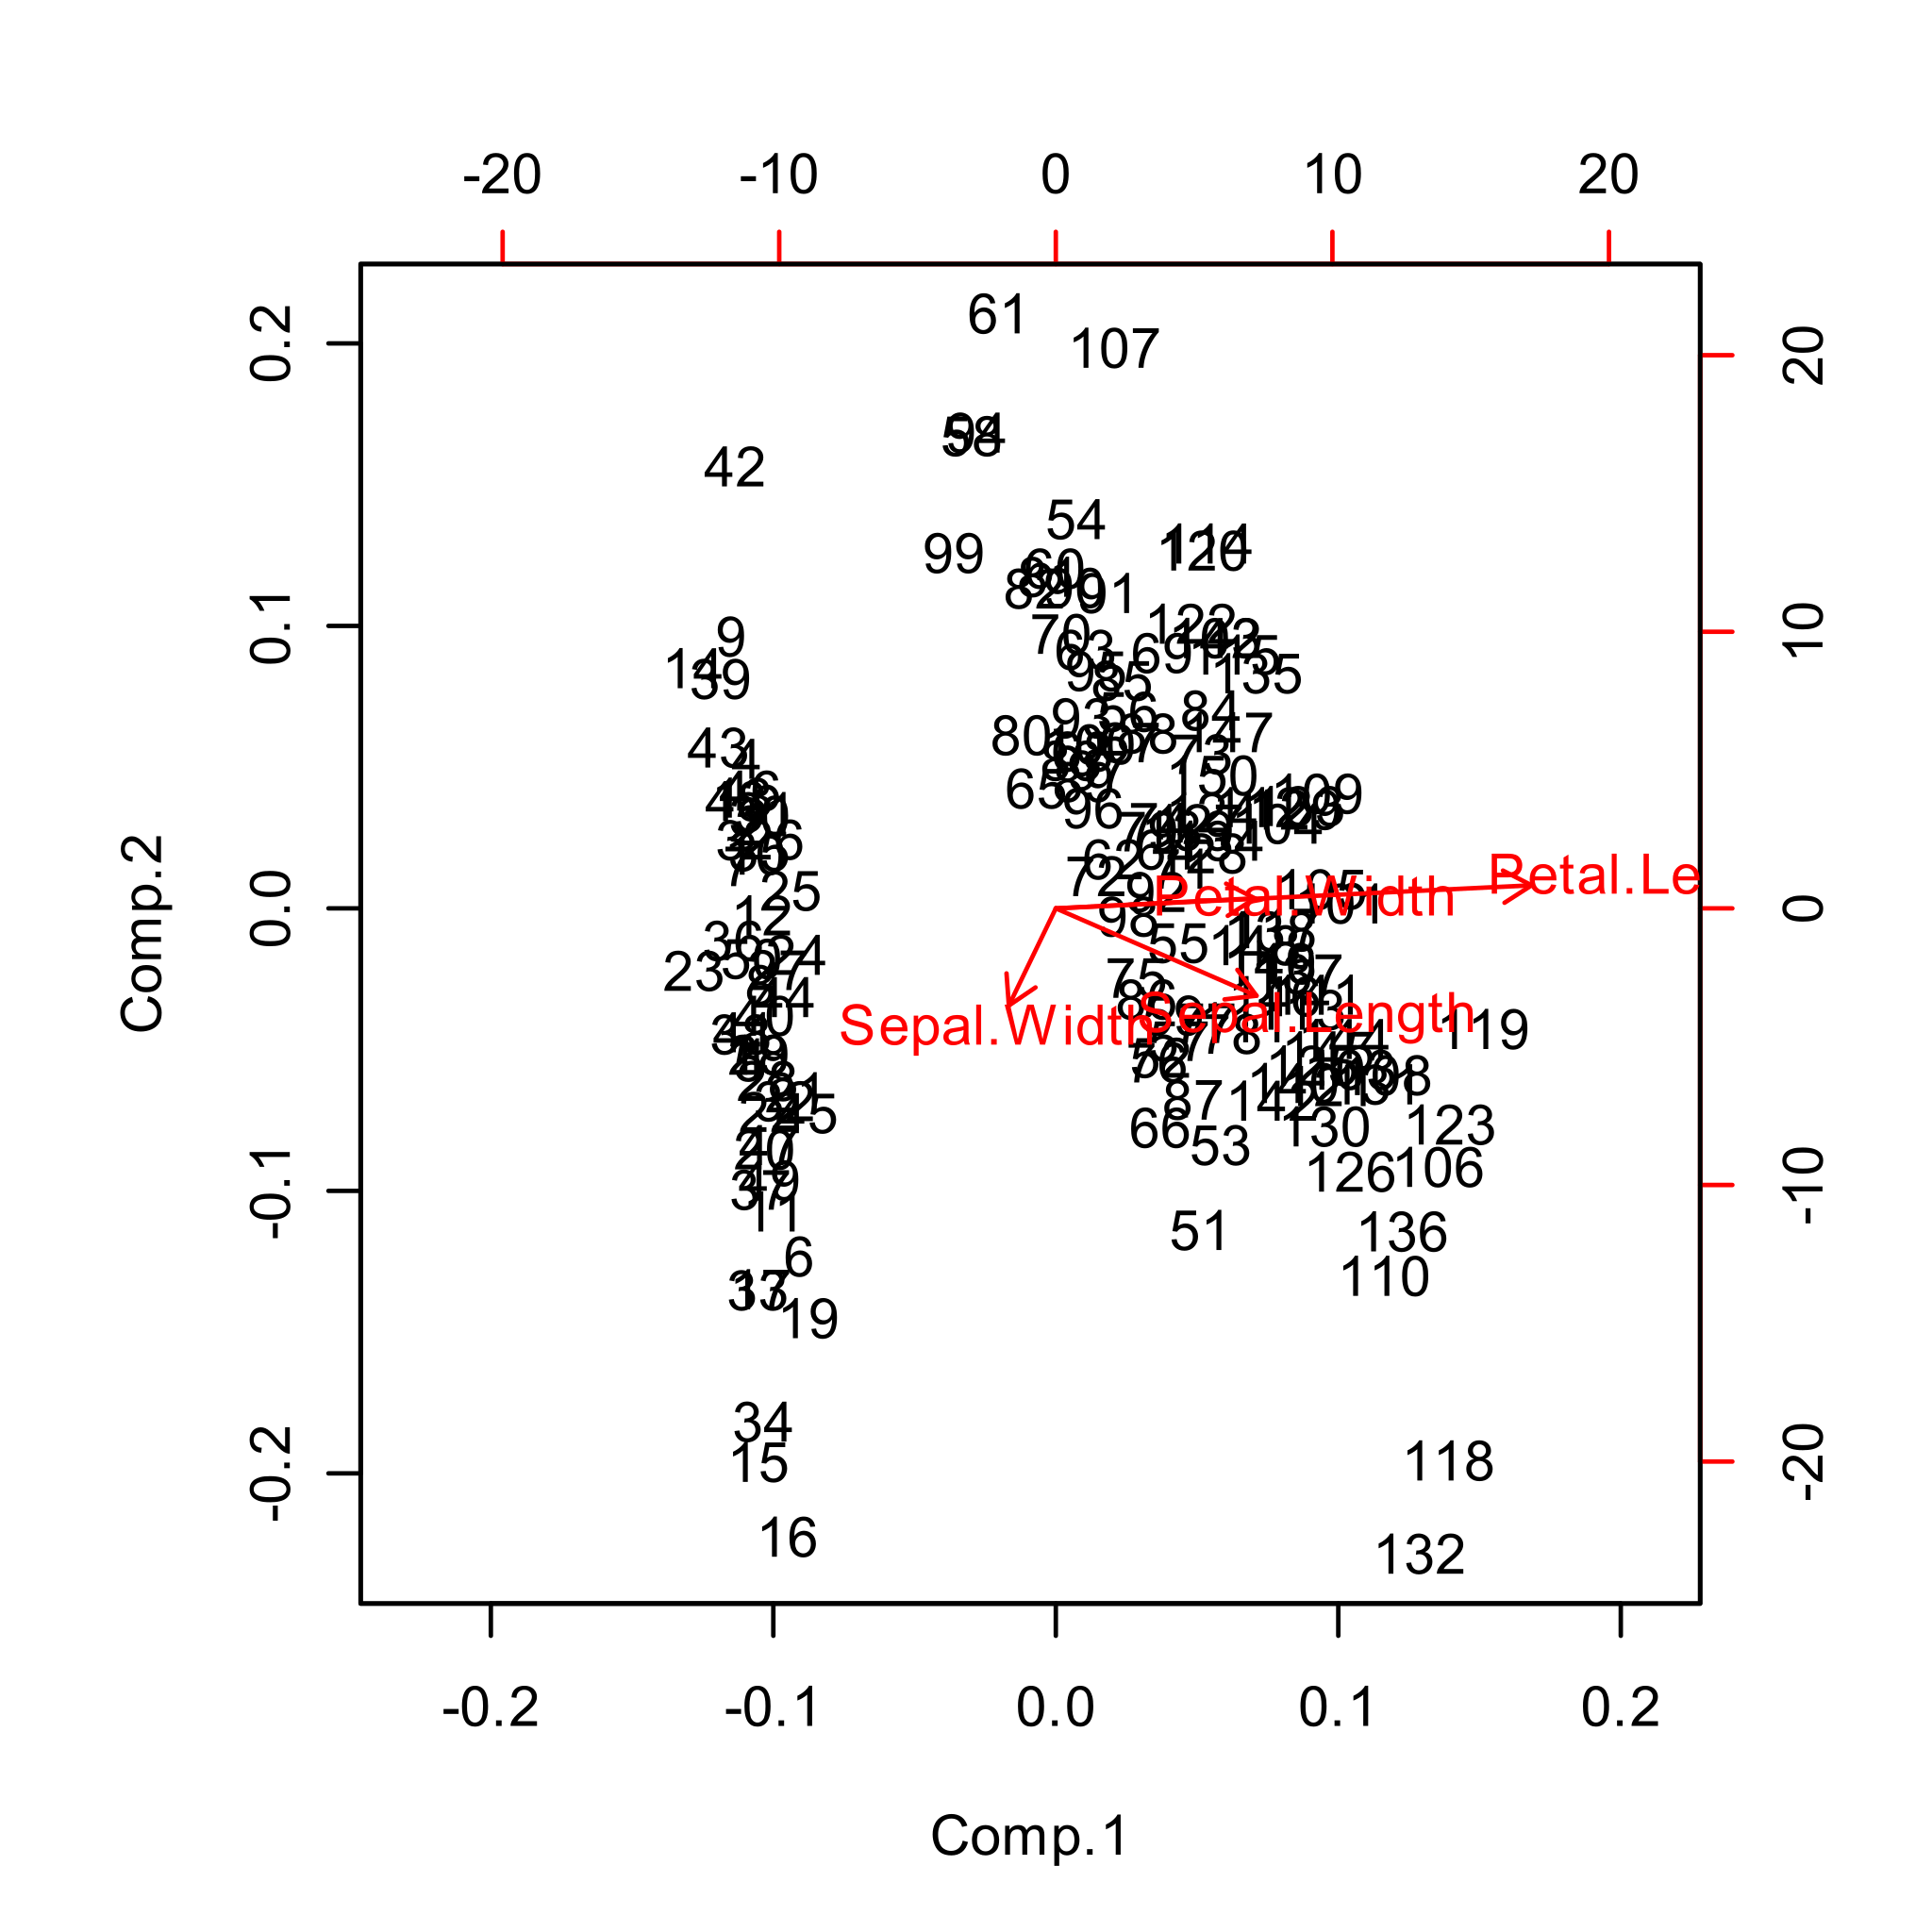
| 描述 | Biplot of the Principal components analysis of Anderson's Iris data set. The SVG was created with R's biplot function using the CairoSVG device of the Cairo R package |
| 日期 | |
| 来源 | I created this work entirely by myself. |
| 作者 | Calimo |
| SVG开发 | |
| 源代码 | R codelibrary(Cairo)
CairoSVG("Biplot_of_Anderson's_Iris_data_set.svg")
biplot(princomp(iris[,1:4], scale=TRUE))
dev.off()
|
许可协议[编辑]
| 我,本作品著作权人,释出本作品至公有领域。这适用于全世界。 在一些国家这可能不合法;如果是这样的话,那么: 我无条件地授予任何人以任何目的使用本作品的权利,除非这些条件是法律规定所必需的。 |
References[编辑]
- Gabriel, K.R., 1971. The biplot graphic display of matrices with application to principal component analysis. Biometrika 58 (3), 453-467.
文件历史
点击某个日期/时间查看对应时刻的文件。
| 日期/时间 | 缩略图 | 大小 | 用户 | 备注 | |
|---|---|---|---|---|---|
| 当前 | 2008年10月14日 (二) 21:18 | | 540 × 540(84 KB) | Mdd(留言 | 贡献) | == Summary == {{Information |Description=Biplot of the Principal components analysis of Anderson's Iris data set. The SVG was created with R's biplot function using the <tt>CairoSVG</tt> device of the <tt>Cairo</tt> R |
您不可以覆盖此文件。
文件用途
以下3个页面使用本文件:
全域文件用途
以下其他wiki使用此文件:
- ca.wikipedia.org上的用途
- de.wikipedia.org上的用途
- en.wikipedia.org上的用途
- en.wikiversity.org上的用途
- fa.wikipedia.org上的用途
- ja.wikipedia.org上的用途
- pt.wikipedia.org上的用途
- zh.wikipedia.org上的用途