File:CAP2004beneficiaries.png
ナビゲーションに移動
検索に移動
高解像度版はありません。
CAP2004beneficiaries.png (714 × 468 ピクセル、ファイルサイズ: 9キロバイト、MIME タイプ: image/png)
キャプション
キャプション
このファイルの内容を1行で記述してください
La bildo estas kopiita de wikipedia:en. La originala priskribo estas:
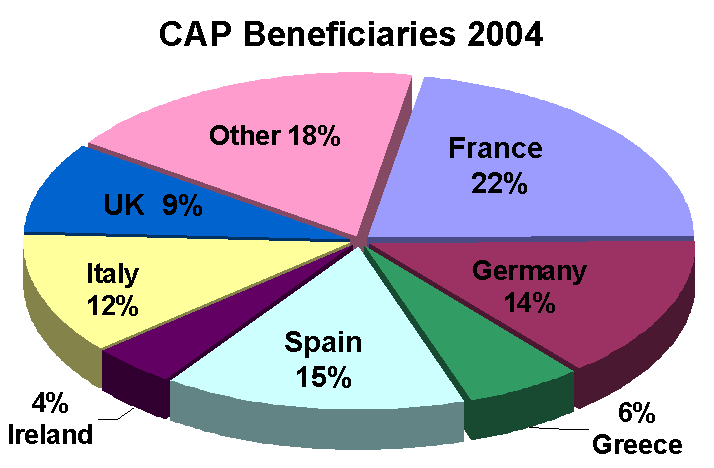
Pie chart illustrating percentage of EU spending on CAP going to different member states 2004. Drawn by me, December 2005.
| この著作物は、著作者である英語版ウィキペディアのSandpiperさんによって権利が放棄され、パブリックドメインとされました。これは全世界で適用されます。 一部の国では、これが法的に可能ではない場合があります。その場合は、次のように宣言します。 Sandpiperは、あらゆる人に対して、法により必要とされている条件を除き、如何なる条件も課すことなく、あらゆる目的のためにこの著作物を使用する権利を与えます。 |
| date/time | username | edit summary |
|---|---|---|
| 13:24, 18 December 2005 | en:User:Sandpiper | (wish there was simple information of licensing tags) |
| 13:15, 18 December 2005 | en:User:Sandpiper | (Pie chart illustrating percentage of EU spending on CAP going to different member states 2004. Drawn by me, December 2005) |


|
このchart画像は、ベクターイメージである SVG ファイルとして再作成されるべきです。これにはいくつかの利点があります。詳しくはCommons:Media for cleanupを参照してください。この画像の SVG 形式がすでに利用可能である場合は、アップロードしてください。アップロード後、この画像にあるこのテンプレートを{{Vector version available|新しい画像ファイル名.svg}}テンプレートで置き換えてください。
|
元のアップロードログ[編集]
Legend: (cur) = this is the current file, (del) = delete this old version, (rev) = revert to this old version.
Click on date to download the file or see the image uploaded on that date.
- (del) (cur) 13:15, 18 December 2005 . . en:User:Sandpiper Sandpiper ( en:User_talk:Sandpiper Talk) . . 714x468 (12640 bytes) (Pie chart illustrating percentage of EU spending on CAP going to different member states 2004. Drawn by me, December 2005)
en:Image:CAP2004beneficiaries.gif
元のアップロードログ[編集]
| 日付と時刻 | 寸法 | 利用者 | コメント |
|---|---|---|---|
| 2006年4月1日, 07:47:10 | 714 × 468 (12640 bytes) | Maksim (トーク · 投稿記録) | La bildo estas kopiita de wikipedia:en. La originala priskribo estas: Pie chart illustrating percentage of EU spending on CAP going to different member states 2004. Drawn by me, December 2005.{{PD-user|[[User:Sandpiper|Sandpiper]]}} {| border="1" ! date |
ファイルの履歴
過去の版のファイルを表示するには、その版の日時をクリックしてください。
| 日付と時刻 | サムネイル | 寸法 | 利用者 | コメント | |
|---|---|---|---|---|---|
| 現在の版 | 2014年8月28日 (木) 01:03 | | 714 × 468 (9キロバイト) | GifTagger (トーク | 投稿記録) | Bot: Converting file to superior PNG file. (Source: CAP2004beneficiaries.gif). This GIF was problematic due to non-greyscale color table. |
このファイルは上書きできません。
ファイルの使用状況
以下の 2 ページがこのファイルを使用しています:
グローバルなファイル使用状況
以下に挙げる他のウィキがこの画像を使っています:
- en.wikipedia.org での使用状況
- eo.wikipedia.org での使用状況
- fr.wikipedia.org での使用状況
- ja.wikipedia.org での使用状況
- pt.wikipedia.org での使用状況