File:CIExy1931 MacAdam.png
元のファイル (1,140 × 1,260 ピクセル、ファイルサイズ: 417キロバイト、MIME タイプ: image/png)
キャプション
キャプション

|
この文書は、フリーソフトウェア財団発行のGNUフリー文書利用許諾書 (GNU Free Documentation License) 1.2またはそれ以降のバージョンの規約に基づき、複製や再配布、改変が許可されます。不可変更部分、表紙、背表紙はありません。このライセンスの複製は、GNUフリー文書利用許諾書という章に含まれています。 |
| このファイルはクリエイティブ・コモンズ 表示-継承 3.0 非移植ライセンスのもとに利用を許諾されています。 | ||
| ||
| このライセンスのテンプレートは、GFDLのライセンス・アップデートによりこのファイルに追加されたものです。 |

|
このダイアグラムの画像は、ベクターイメージである SVG ファイルとして再作成されるべきです。これにはいくつかの利点があります。詳しくはCommons:Media for cleanupを参照してください。この画像の SVG 形式がすでに利用可能である場合は、アップロードしてください。アップロード後、この画像にあるこのテンプレートを{{Vector version available|新しい画像ファイル名.svg}}テンプレートで置き換えてください。
|
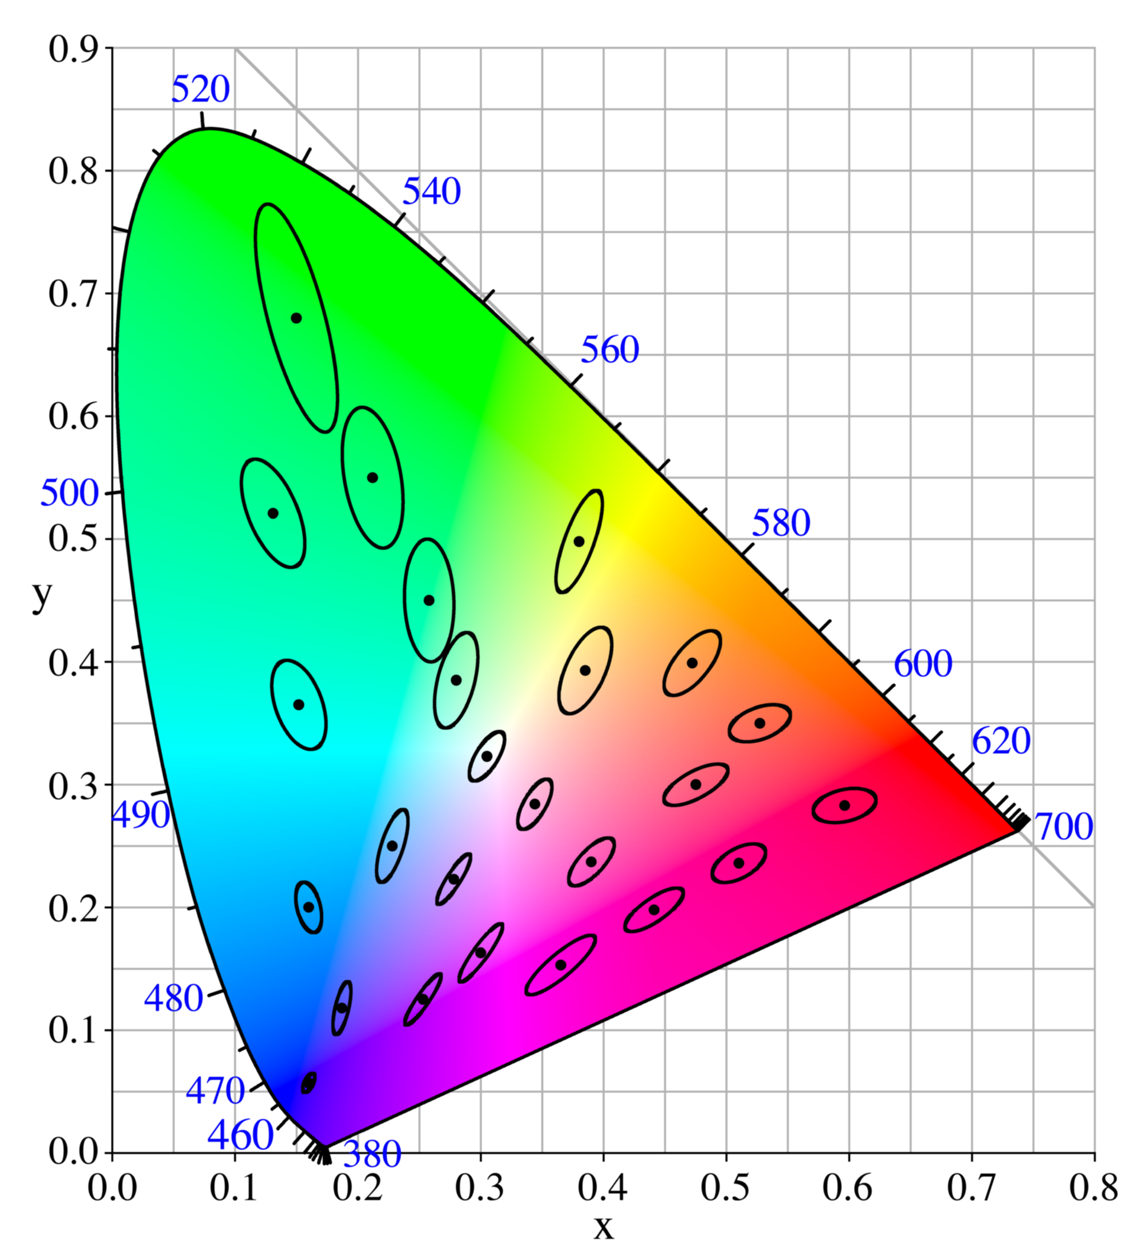
MacAdam(1942) ellipses plotted on the CIE xy 1931 chromaticity diagram. Ellipses are 10 x actual size.
Data taken from Günter Wyszecki and Walter Stanley Stiles, Color Science: Concepts and Methods, Quantitative Data and Formula (2nd edition), Wiley-Interscience. (July 28, 2000). ISBN 0-471-39918-3, Table 2(5.4.1). Each ellipse is centered at [x,y] in the CIE (xy) chromaticity coordinates, with major and minor radii a and b respectively. t is the angle in degrees of the major axis with respect to the x axis, with positive angles going counter-clockwise.
  x     y  10^3a 10^3b t
0.160 0.057 0.85 0.35  62.5
0.187 0.118 2.20 0.55  77.0
0.253 0.125 2.50 0.50  55.5
0.150 0.680 9.60 2.30 105.0
0.131 0.521 4.70 2.00 112.5
0.212 0.550 5.80 2.30 100.0
0.258 0.450 5.00 2.00  92.0
0.152 0.365 3.80 1.90 110.0
0.280 0.385 4.00 1.50  75.5
0.380 0.498 4.40 1.20  70.0
0.160 0.200 2.10 0.95 104.0
0.228 0.250 3.10 0.90  72.0
0.305 0.323 2.30 0.90  58.0
0.385 0.393 3.80 1.60  65.5
0.472 0.399 3.20 1.40  51.0
0.527 0.350 2.60 1.30  20.0
0.475 0.300 2.90 1.10  28.5
0.510 0.236 2.40 1.20  29.5
0.596 0.283 2.60 1.30  13.0
0.344 0.284 2.30 0.90  60.0
0.390 0.237 2.50 1.00  47.0
0.441 0.198 2.80 0.95  34.5
0.278 0.223 2.40 0.55  57.5
0.300 0.163 2.90 0.60  54.0
0.365 0.153 3.60 0.95  40.0
Plots were made as parametric in f where f ranged from 0 to 2 pi
 aa=a[i]*cos(f)
 bb=b[i]*sin(f)
 xx=x[i]+aa*cos(t[i])-bb*sin(t[i])
 yy=y[i]+aa*sin(t[i])+bb*cos(t[i])
 plot,xx,yy
Please see Image:CIExy1931.png for a description of how this image was made.
ファイルの履歴
過去の版のファイルを表示するには、その版の日時をクリックしてください。
| 日付と時刻 | サムネイル | 寸法 | 利用者 | コメント | |
|---|---|---|---|---|---|
| 現在の版 | 2005年6月2日 (木) 13:34 | | 1,140 × 1,260 (417キロバイト) | PAR~commonswiki (トーク | 投稿記録) | MacAdam(1942) ellipses plotted on the CIE xy 1931 chromaticity diagram. Ellipses are 10 x actual size. |
このファイルは上書きできません。
ファイルの使用状況
以下の 2 ページがこのファイルを使用しています:
グローバルなファイル使用状況
以下に挙げる他のウィキがこの画像を使っています:
- ca.wikipedia.org での使用状況
- de.wikipedia.org での使用状況
- en.wikipedia.org での使用状況
- fr.wikipedia.org での使用状況
- hu.wikipedia.org での使用状況
- ja.wikipedia.org での使用状況