File:Carbon cycle-cute diagram-german.svg
Aller à la navigation
Aller à la recherche

Taille de cet aperçu PNG pour ce fichier SVG : 540 × 417 pixels. Autres résolutions : 311 × 240 pixels | 622 × 480 pixels | 995 × 768 pixels | 1 280 × 988 pixels | 2 560 × 1 977 pixels.
Fichier d’origine (Fichier SVG, nominalement de 540 × 417 pixels, taille : 249 kio)
Légendes
Légendes
Ajoutez en une ligne la description de ce que représente ce fichier
| Description |
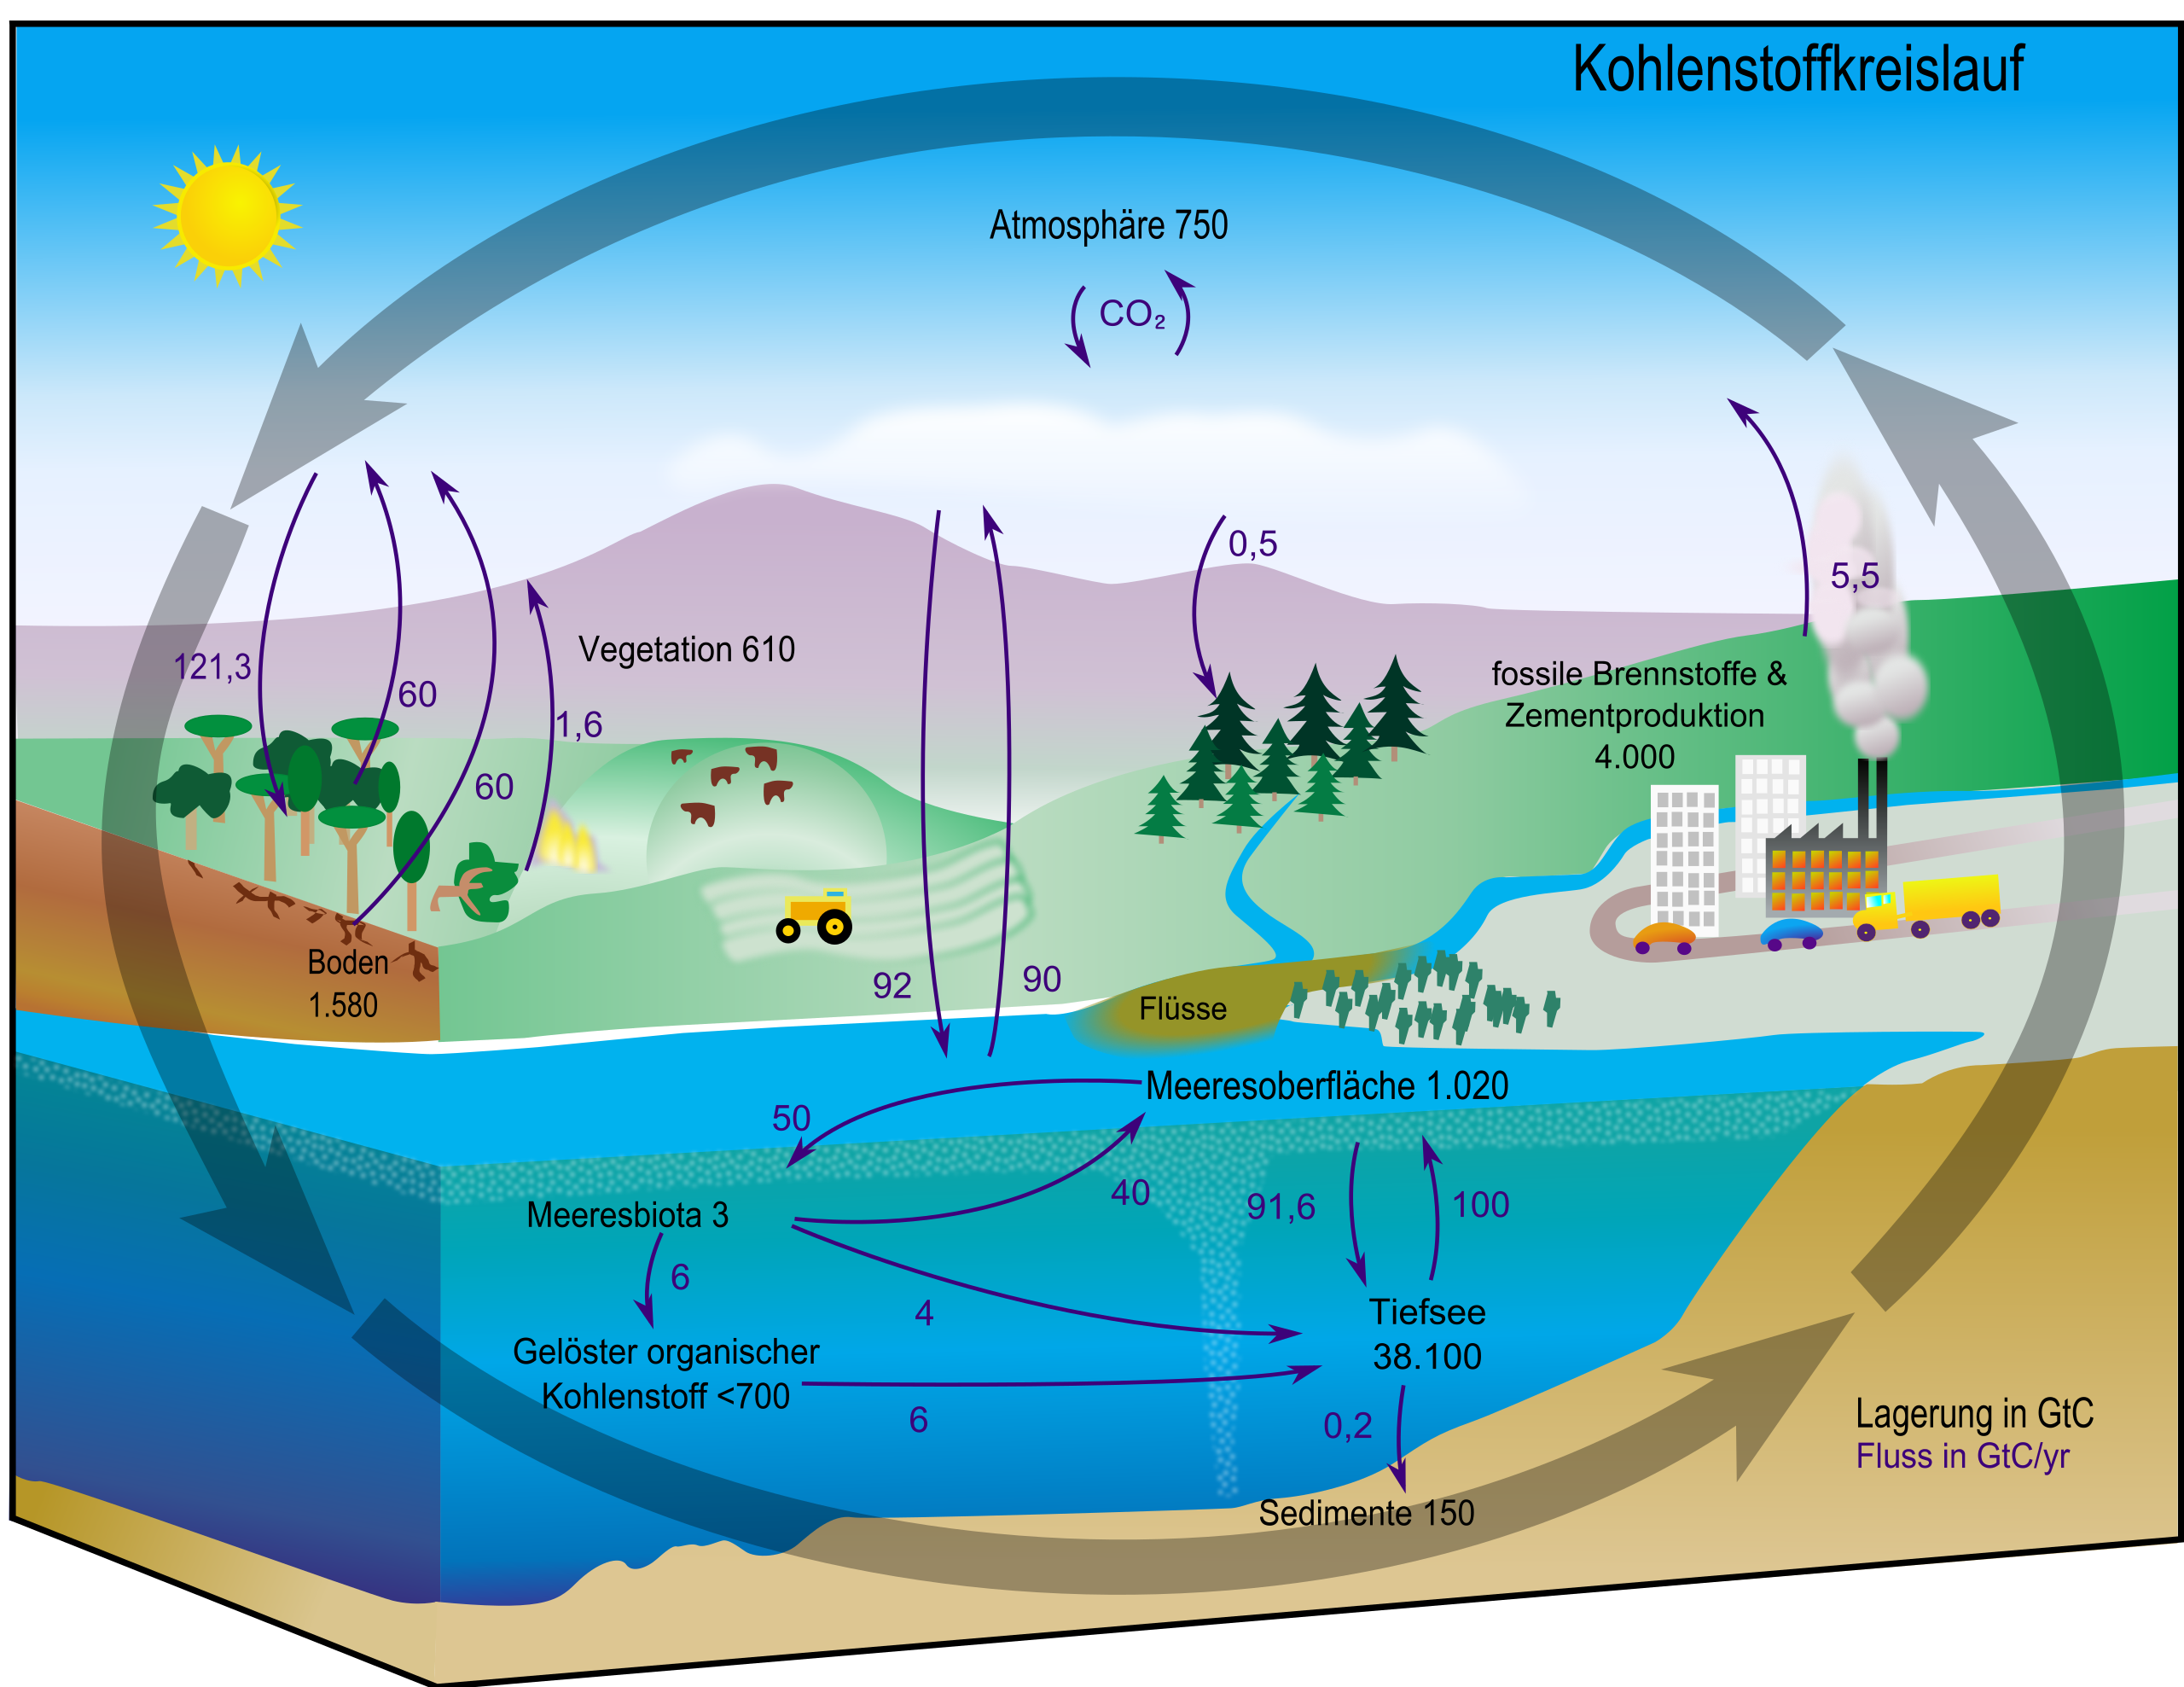
English: This carbon cycle diagram shows the storage and annual exchange of carbon between the atmosphere, hydrosphere and geosphere in gigatons - or billions of tons - of Carbon (GtC). Burning fossil fuels by people adds about 5.5 GtC of carbon per year into the atmosphere.
Deutsch: Diagramm des Kohlenstoffkreislaufes. Die schwarzen Zahlen zeigen wie viele Milliarden Tonnen Kohlenstoff (Gt C) in den verschiedenen Reservoiren vorhanden sind. Die blauen Zahlen zeigen an, wie viel Kohlenstoff zwischen den einzelnen Speichern pro Jahr ausgetauscht wird.
Español: Este esquema del ciclo del carbono muestra el almacenamiento y los cambios anuales del carbono entre la atmósfera, la hidrósfera y la geósfera en gigatones, o billones de toneladas, de carbono (GtC). La quema de conustibles fósiles libera cerca de 5.5 billones de toneladas de carbono al año en la atmósfera.
日本語: 炭素循環の概念図。黒の数値はそれぞれのリザーバーに存在する炭素量、青の数値はリザーバー間での年間の炭素の移動量。単位はギガt(10億トン)
Русский: Схема геохимического цикла углерода показывает количество углерода в атмосфере, гидросфере, и геосфере Земли, а также годовой перенос углерода между ними. Все величины в гигатоннах (миллиардах тонн). В результате сжигания ископаемого топлива, человечество ежегодно добавляет 5,5 гигатонн углерода в атмосферу. |
| Date | (UTC) |
| Source | |
| Auteur |
|
| Autres versions |
[] Single-language versions
|


| Cette image a été retouchée, ce qui signifie qu'elle a été modifiée par ordinateur et est différente de l'image d'origine. Liste des modifications : version in german. L'image d'origine se trouve ici : Carbon cycle-cute diagram.jpeg:
|
| Moi, propriétaire des droits d’auteur sur cette œuvre, la place dans le domaine public. Ceci s'applique dans le monde entier. Dans certains pays, ceci peut ne pas être possible ; dans ce cas : J’accorde à toute personne le droit d’utiliser cette œuvre dans n’importe quel but, sans aucune condition, sauf celles requises par la loi. |
Journal des téléversements d’origine
[modifier]
This image is a derivative work of the following images:
- Image:Carbon_cycle-cute_diagram.svg licensed with PD-self
- 2008-06-01T02:20:22Z FischX 540x417 (154403 Bytes) {{Information |Description= |Source= |Date= |Author= |Permission= |other_versions= }}
- 2008-05-30T02:17:27Z FischX 540x417 (125503 Bytes) {{Information |Description= |Source= |Date= |Author= |Permission= |other_versions= }}
- 2008-05-30T02:03:21Z FischX 540x417 (126458 Bytes) {{Information |Description={{en|This [[:en:carbon cycle|carbon cycle]] diagram shows the storage and annual exchange of carbon between the [[:en:Earth's atmosphere|atmosphere]], [[:en:hydrosphere|hydrosphere]] and [[:en:geosp
- Image:Carbon_cycle-cute_diagram.jpeg licensed with PD-USGov-NASA, PD-USGov-NASA/copyright
- 2006-09-12T15:16:24Z Giac83 540x417 (53453 Bytes) {{Information| |Description= This [[:en:carbon cycle]] diagram shows the storage and yearly changes of the carbon between the [[:en:Earth's atmosphere|atmosphere]], [[:en:hydrosphere]] and [[:en:geosphere]] in Gigatons - or b
Téléversé avec derivativeFX
Historique du fichier
Cliquer sur une date et heure pour voir le fichier tel qu'il était à ce moment-là.
| Date et heure | Vignette | Dimensions | Utilisateur | Commentaire | |
|---|---|---|---|---|---|
| actuel | 27 juin 2011 à 16:42 | | 540 × 417 (249 kio) | Yikrazuul (d | contributions) | minor fixes |
| 14 octobre 2008 à 18:59 |  | 540 × 417 (161 kio) | FischX (d | contributions) | {{Information |Description= |Source= |Date= |Author= |Permission= |other_versions= }} | |
| 12 juin 2008 à 01:24 |  | 540 × 417 (161 kio) | FischX (d | contributions) | Reverted to version as of 01:17, 12 June 2008 | |
| 12 juin 2008 à 01:24 |  | 540 × 417 (151 kio) | FischX (d | contributions) | Reverted to version as of 21:53, 2 June 2008 | |
| 12 juin 2008 à 01:17 |  | 540 × 417 (161 kio) | FischX (d | contributions) | {{Information |Description= |Source= |Date= |Author= |Permission= |other_versions= }} | |
| 2 juin 2008 à 21:53 |  | 540 × 417 (151 kio) | FischX (d | contributions) | {{Information |Description= |Source= |Date= |Author= |Permission= |other_versions= }} | |
| 2 juin 2008 à 21:46 |  | 540 × 417 (151 kio) | FischX (d | contributions) | {{Information |Description={{en|This carbon cycle diagram shows the storage and annual exchange of carbon between the atmosphere, hydrosphere and geosphere in gigatons - |
Vous ne pouvez pas remplacer ce fichier.
Utilisations locales du fichier
Les 13 pages suivantes utilisent ce fichier :
- File:Carbon cycle-cute-diagram-fi.svg
- File:Carbon cycle-cute diagram-ca.svg
- File:Carbon cycle-cute diagram-german.png
- File:Carbon cycle-cute diagram-german.svg
- File:Carbon cycle-cute diagram-zh-Hans.jpeg
- File:Carbon cycle-cute diagram.jpeg
- File:Carbon cycle-cute diagram.svg
- File:Carbon cycle-cute diagram ar.svg
- File:Carbon cycle-cute diagram cs.svg
- File:Carbon cycle-cute diagram zh-hant.svg
- File:Diagrama carbono lindo esp.svg
- File:Круговорот углерода.svg
- Template:Other versions/Carbon cycle-cute diagram
Utilisations du fichier sur d’autres wikis
Les autres wikis suivants utilisent ce fichier :
- Utilisation sur de.wikipedia.org
- Utilisation sur de.wikiversity.org
- Utilisation sur it.wikipedia.org