File:Carnot cycle p-V diagram.svg
Spring til navigation
Spring til søgning

Size of this PNG preview of this SVG file: 750 × 600 pixels. Andre opløsninger: 300 × 240 pixels | 600 × 480 pixels | 960 × 768 pixels | 1.280 × 1.024 pixels | 2.560 × 2.048 pixels | 1.000 × 800 pixels.
Oprindelig fil (SVG fil, basisstørrelse 1.000 × 800 pixels, filstørrelse: 14 KB)
Captions
Captions
Tilføj en kort forklaring på en enkelt linje om hvad filen viser
Beskrivelse[redigér]
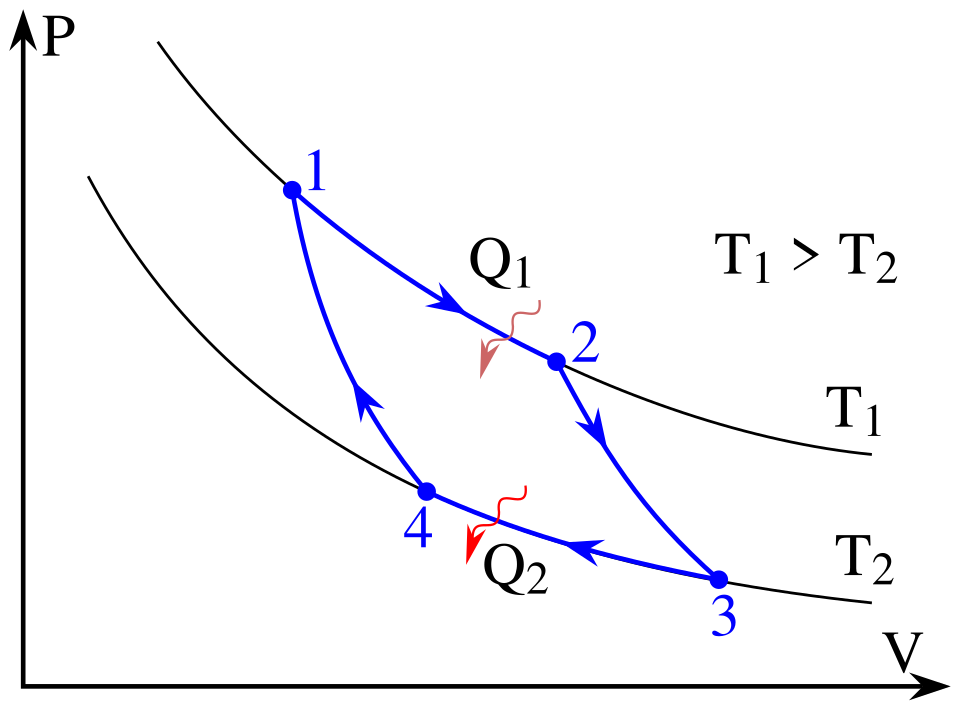
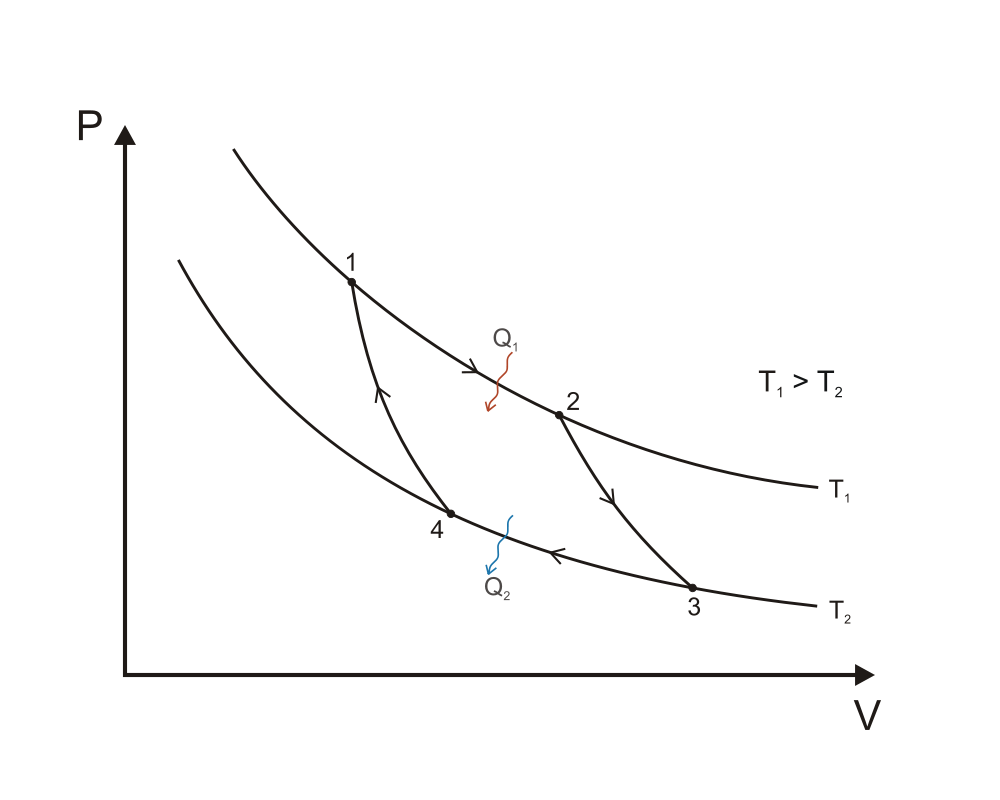
| Beskrivelse | Carnot cycle |
| Dato | 3. april 2006 (original upload date) |
| Kilde | Eget arbejde |
| Forfatter | Keta |
| SVG udvikling |
Licensering[redigér]
| This chart is ineligible for copyright and therefore in the public domain, because it consists entirely of information that is common property and contains no original authorship. For more information, see Commons:Threshold of originality § Charts
|
Filhistorik
Klik på en dato/tid for at se filen som den så ud på det tidspunkt.
| Dato/tid | Miniaturebillede | Dimensioner | Bruger | Kommentar | |
|---|---|---|---|---|---|
| nuværende | 3. apr. 2006, 12:31 | | 1.000 × 800 (14 KB) | Keta (diskussion | bidrag) | Added background |
| 3. apr. 2006, 12:15 |  | 1.000 × 800 (14 KB) | Keta (diskussion | bidrag) | Pressure - volume (p-V) diagram of the Carnot cycle | |
| 3. apr. 2006, 10:45 |  | 1.000 × 800 (14 KB) | Keta (diskussion | bidrag) | Pressure-volume (p-V) diagram for the Carnot cycle. |
Du kan ikke overskrive denne fil.
Filanvendelse
De følgende 2 sider bruger denne fil:
Global filanvendelse
Følgende andre wikier anvender denne fil:
- Anvendelser på bg.wikipedia.org
- Anvendelser på bn.wikipedia.org
- Anvendelser på ca.wikipedia.org
- Anvendelser på ckb.wikipedia.org
- Anvendelser på da.wikipedia.org
- Anvendelser på el.wikipedia.org
- Anvendelser på en.wikipedia.org
- Anvendelser på en.wiktionary.org
- Anvendelser på eo.wikipedia.org
- Anvendelser på es.wikiversity.org
- Anvendelser på et.wikipedia.org
- Anvendelser på eu.wikipedia.org
- Anvendelser på fi.wikipedia.org
- Anvendelser på fr.wikipedia.org
- Anvendelser på he.wiktionary.org
- Anvendelser på hi.wikipedia.org
- Anvendelser på hr.wikipedia.org
- Anvendelser på hu.wikipedia.org
- Anvendelser på hy.wikipedia.org
- Anvendelser på it.wikipedia.org
- Anvendelser på it.wikibooks.org
- Anvendelser på ja.wikipedia.org
- Anvendelser på kk.wikipedia.org
- Anvendelser på kn.wikipedia.org
- Anvendelser på ko.wikipedia.org
- Anvendelser på lv.wikipedia.org
- Anvendelser på ml.wikipedia.org
- Anvendelser på nn.wikipedia.org
- Anvendelser på pt.wikipedia.org
- Anvendelser på ro.wikipedia.org
- Anvendelser på ru.wikipedia.org
- Anvendelser på sl.wikipedia.org
- Anvendelser på sr.wikipedia.org
- Anvendelser på sv.wikipedia.org
- Anvendelser på ta.wikipedia.org
- Anvendelser på uk.wikipedia.org
- Anvendelser på uz.wikipedia.org
- Anvendelser på vi.wikipedia.org
Vis flere globale anvendelser af denne fil.