File:Carnot cycle p-V diagram.svg
跳至導覽
跳至搜尋

此 SVG 檔案的 PNG 預覽的大小:750 × 600 像素。 其他解析度:300 × 240 像素 | 600 × 480 像素 | 960 × 768 像素 | 1,280 × 1,024 像素 | 2,560 × 2,048 像素 | 1,000 × 800 像素。
原始檔案 (SVG 檔案,表面大小:1,000 × 800 像素,檔案大小:14 KB)
說明
說明
添加單行說明來描述出檔案所代表的內容
檔案歷史
點選日期/時間以檢視該時間的檔案版本。
| 日期/時間 | 縮圖 | 尺寸 | 使用者 | 備註 | |
|---|---|---|---|---|---|
| 目前 | 2006年4月3日 (一) 12:31 | | 1,000 × 800(14 KB) | Keta(留言 | 貢獻) | Added background |
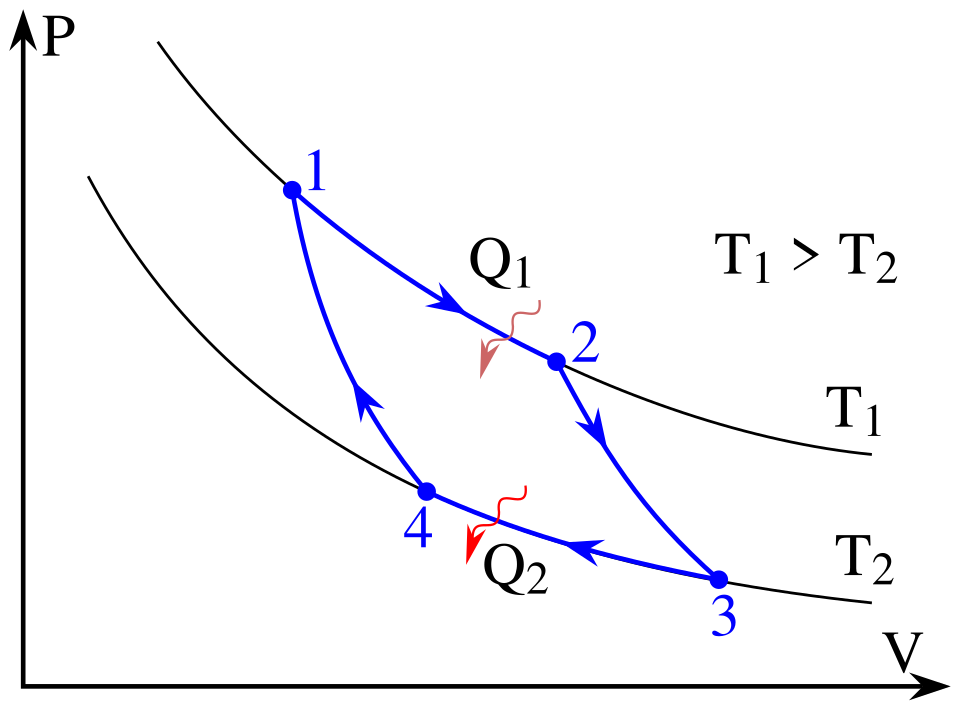
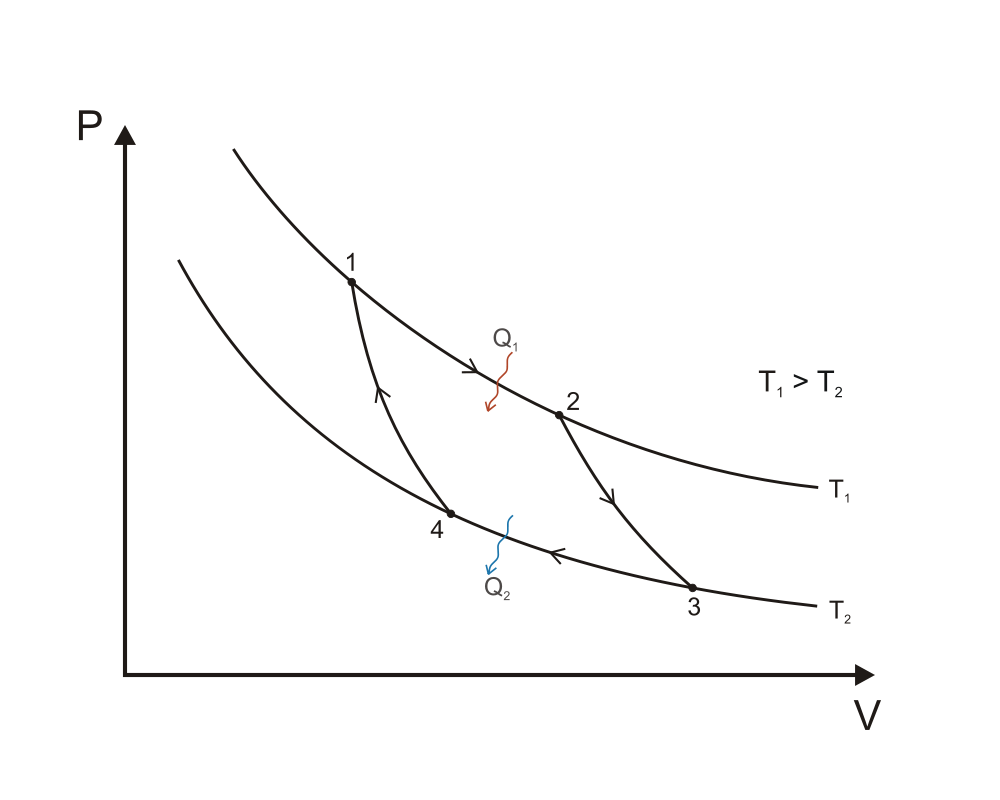
| 2006年4月3日 (一) 12:15 |  | 1,000 × 800(14 KB) | Keta(留言 | 貢獻) | Pressure - volume (p-V) diagram of the Carnot cycle | |
| 2006年4月3日 (一) 10:45 |  | 1,000 × 800(14 KB) | Keta(留言 | 貢獻) | Pressure-volume (p-V) diagram for the Carnot cycle. |
無法覆蓋此檔案。
檔案用途
下列2個頁面有用到此檔案:
全域檔案使用狀況
以下其他 wiki 使用了這個檔案:
- bg.wikipedia.org 的使用狀況
- bn.wikipedia.org 的使用狀況
- ca.wikipedia.org 的使用狀況
- ckb.wikipedia.org 的使用狀況
- da.wikipedia.org 的使用狀況
- el.wikipedia.org 的使用狀況
- en.wikipedia.org 的使用狀況
- en.wiktionary.org 的使用狀況
- eo.wikipedia.org 的使用狀況
- es.wikiversity.org 的使用狀況
- et.wikipedia.org 的使用狀況
- eu.wikipedia.org 的使用狀況
- fi.wikipedia.org 的使用狀況
- fr.wikipedia.org 的使用狀況
- he.wiktionary.org 的使用狀況
- hi.wikipedia.org 的使用狀況
- hr.wikipedia.org 的使用狀況
- hu.wikipedia.org 的使用狀況
- hy.wikipedia.org 的使用狀況
- it.wikipedia.org 的使用狀況
- it.wikibooks.org 的使用狀況
- ja.wikipedia.org 的使用狀況
- kk.wikipedia.org 的使用狀況
- kn.wikipedia.org 的使用狀況
- ko.wikipedia.org 的使用狀況
- lv.wikipedia.org 的使用狀況
- ml.wikipedia.org 的使用狀況
- nn.wikipedia.org 的使用狀況
- pt.wikipedia.org 的使用狀況
- ro.wikipedia.org 的使用狀況
- ru.wikipedia.org 的使用狀況
- sl.wikipedia.org 的使用狀況
- sr.wikipedia.org 的使用狀況
- sv.wikipedia.org 的使用狀況
- ta.wikipedia.org 的使用狀況
- uk.wikipedia.org 的使用狀況
檢視此檔案的更多全域使用狀況。