File:Changing Face of the North America Nebula.jpg
原始檔案 (6,000 × 6,003 像素,檔案大小:16.93 MB,MIME 類型:image/jpeg)
說明
說明
摘要
[編輯]| 描述 |
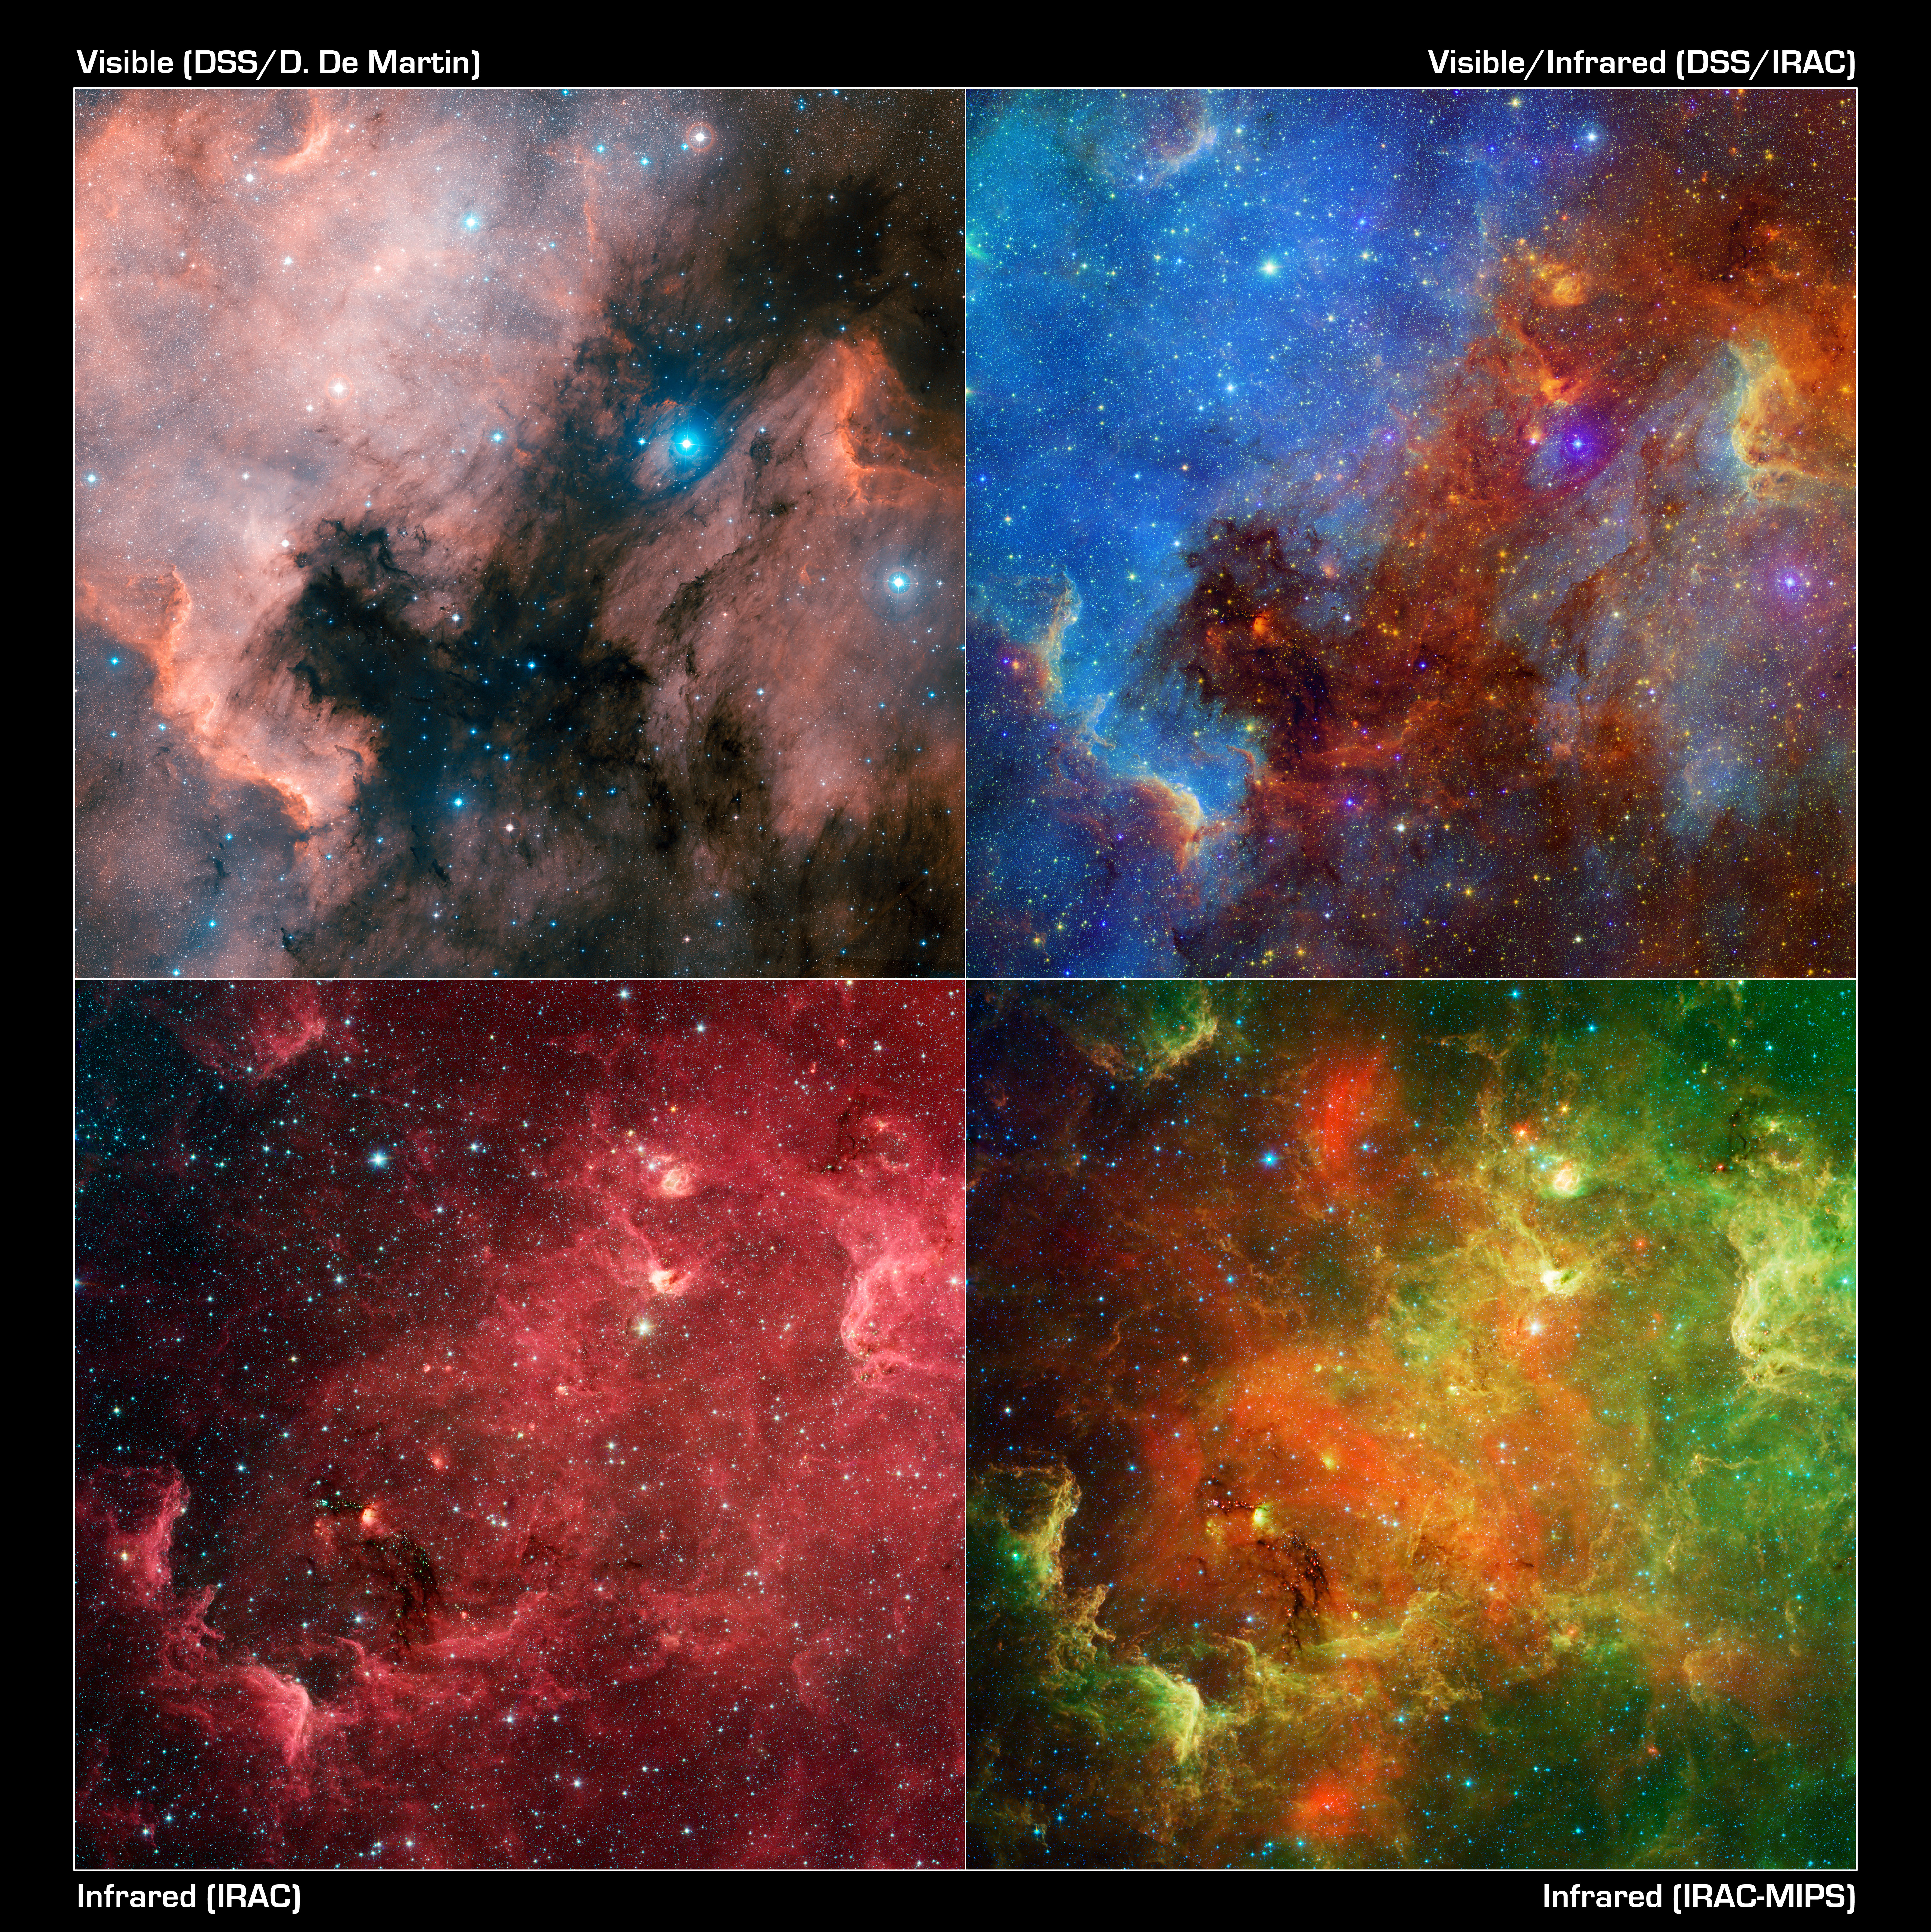
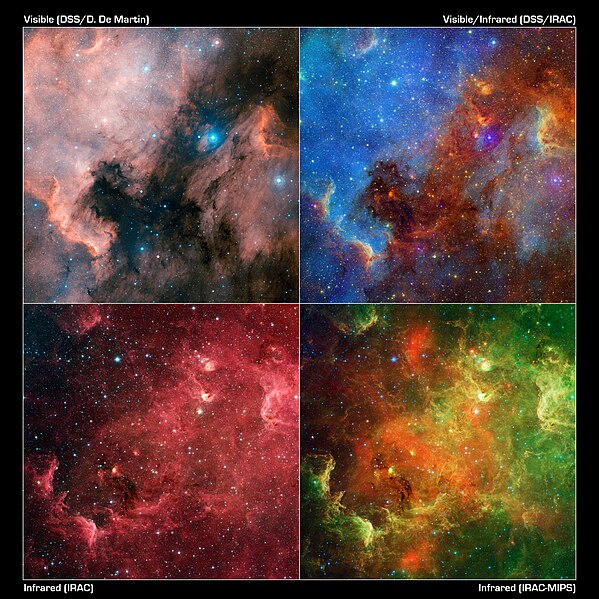
English: This layout of images reveals how the appearance of the North America nebula can change dramatically using different combinations of visible and infrared observations from the Digitized Sky Survey and NASA's Spitzer Space Telescope, respectively.
In this progression, the visible-light view (upper left) shows a striking similarity to the North America continent. Each is cropped to the easterly bulk (thus also the quasi-"Gulf of Mexico" region). The red region to the right is known as the "Pelican nebula," after its resemblance in visible light to a pelican. The view at upper right includes both visible and infrared observations. The hot gas comprising the North America continent and the Pelican now takes on a vivid blue hue, while red colours display the infrared light. Inky black dust features start to glow in the infrared view. In the bottom two images, only infrared light from Spitzer is shown -- data from the infrared array camera is on the left, and data from both the infrared array camera and the multi-band imaging photometer, which sees longer wavelengths, is on the right. These pictures look different in part because infrared light can penetrate dust whereas visible light cannot. Dusty, dark clouds in the visible image become transparent in Spitzer's view. In addition, Spitzer's infrared detectors pick up the glow of dusty cocoons enveloping baby stars. |
| 日期 | |
| 來源 | NASA JPL |
| 作者 | NASA/JPL-Caltech/L. Rebull (SSC/Caltech) |
| 其他版本 |

Colour is used to display different parts of the spectrum in each of these images. In the visible-light view (upper right) from the Digitized Sky Survey, colours are shown in their natural blue and red hues. The combined visible/infrared image (upper left) shows visible light as blue, and infrared light as green and red. The infrared array camera (lower left) represents light with a wavelength of 3.6 microns as blue, 4.5 microns as green, 5.8 microns as orange, and 8.0 microns as red. In the final image, incorporating the multi-band imaging photometer data, light with a wavelength of 3.6 microns has been colour coded blue; 4.5-micron light is blue-green; 5.8-micron and 8.0-micron light are green; and 24-micron light is red.
授權條款
[編輯]
| 本作品由NASA創作,屬於公有領域。根據NASA的版權政策:“NASA的創作除非另有聲明否則不受版權保護。”(參見:Template:PD-USGov/zh,NASA版權政策或JPL圖像使用政策) | ||
 |
警告:
|
| 註解 | 該圖片含有註解:在維基媒體共享資源上查看註解 |
檔案歷史
點選日期/時間以檢視該時間的檔案版本。
| 日期/時間 | 縮圖 | 尺寸 | 使用者 | 備註 | |
|---|---|---|---|---|---|
| 目前 | 2011年2月16日 (三) 12:09 | | 6,000 × 6,003(16.93 MB) | Originalwana(留言 | 貢獻) | {{Information |Description ={{en|1=This image layout reveals how the appearance of the North America nebula can change dramatically using different combinations of visible and infrared observations from the [[:Category:Digitized |
無法覆蓋此檔案。
檔案用途
下列2個頁面有用到此檔案:
全域檔案使用狀況
以下其他 wiki 使用了這個檔案:
- ar.wikipedia.org 的使用狀況
- cs.wikipedia.org 的使用狀況
- fr.wikipedia.org 的使用狀況
- mk.wikipedia.org 的使用狀況
- my.wikipedia.org 的使用狀況
- pl.wikipedia.org 的使用狀況
- pt.wikipedia.org 的使用狀況
- th.wikipedia.org 的使用狀況
- vi.wikipedia.org 的使用狀況
- zh.wikipedia.org 的使用狀況