File:Changing Face of the North America Nebula.jpg
原始文件 (6,000 × 6,003像素,文件大小:16.93 MB,MIME类型:image/jpeg)
说明
说明
摘要
[编辑]| 描述 |
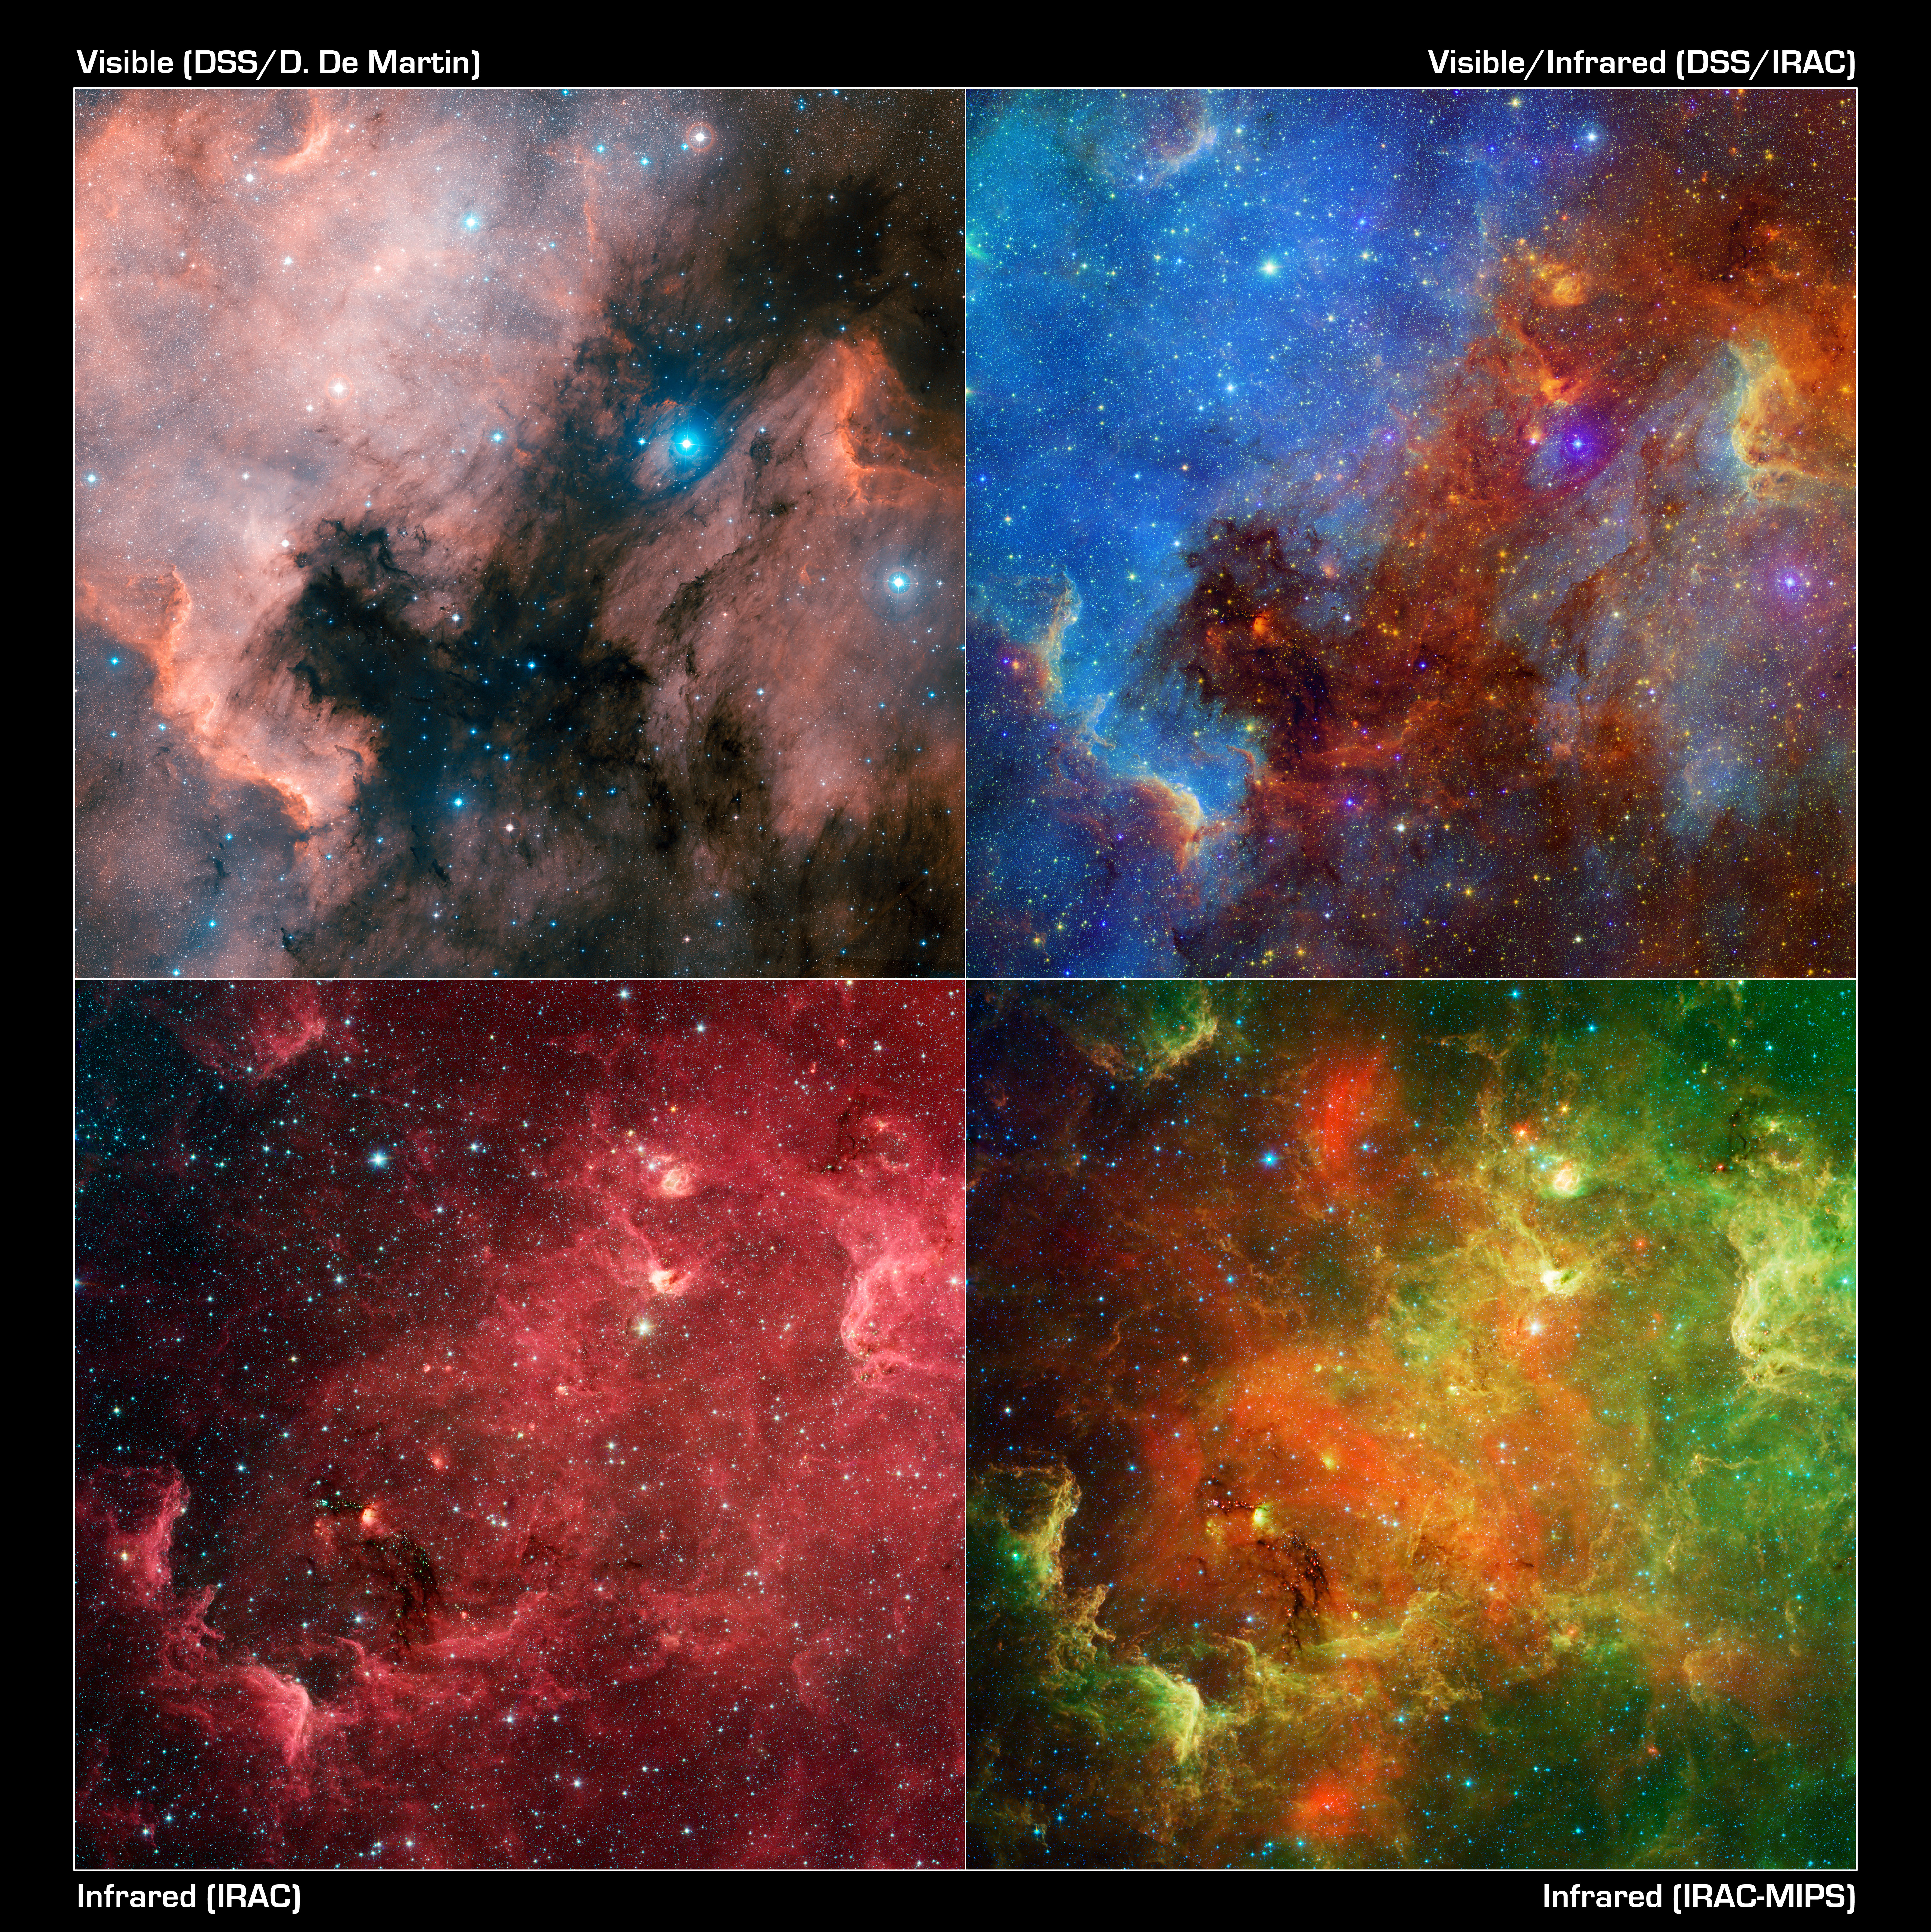
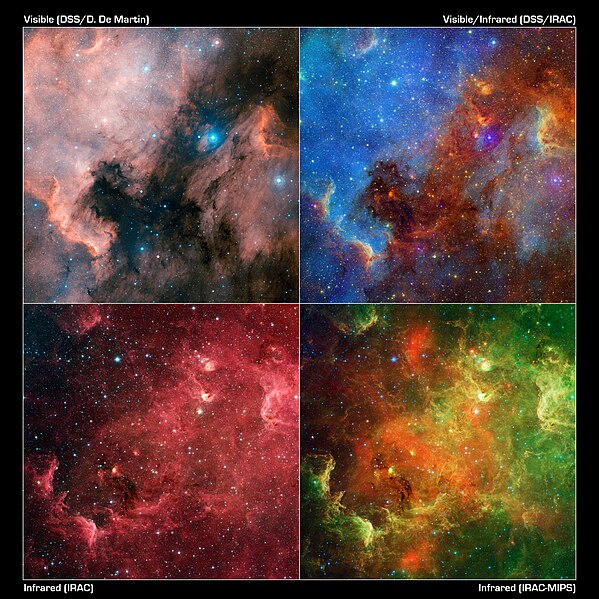
English: This layout of images reveals how the appearance of the North America nebula can change dramatically using different combinations of visible and infrared observations from the Digitized Sky Survey and NASA's Spitzer Space Telescope, respectively.
In this progression, the visible-light view (upper left) shows a striking similarity to the North America continent. Each is cropped to the easterly bulk (thus also the quasi-"Gulf of Mexico" region). The red region to the right is known as the "Pelican nebula," after its resemblance in visible light to a pelican. The view at upper right includes both visible and infrared observations. The hot gas comprising the North America continent and the Pelican now takes on a vivid blue hue, while red colours display the infrared light. Inky black dust features start to glow in the infrared view. In the bottom two images, only infrared light from Spitzer is shown -- data from the infrared array camera is on the left, and data from both the infrared array camera and the multi-band imaging photometer, which sees longer wavelengths, is on the right. These pictures look different in part because infrared light can penetrate dust whereas visible light cannot. Dusty, dark clouds in the visible image become transparent in Spitzer's view. In addition, Spitzer's infrared detectors pick up the glow of dusty cocoons enveloping baby stars. |
| 日期 | |
| 来源 | NASA JPL |
| 作者 | NASA/JPL-Caltech/L. Rebull (SSC/Caltech) |
| 其他版本 |

Colour is used to display different parts of the spectrum in each of these images. In the visible-light view (upper right) from the Digitized Sky Survey, colours are shown in their natural blue and red hues. The combined visible/infrared image (upper left) shows visible light as blue, and infrared light as green and red. The infrared array camera (lower left) represents light with a wavelength of 3.6 microns as blue, 4.5 microns as green, 5.8 microns as orange, and 8.0 microns as red. In the final image, incorporating the multi-band imaging photometer data, light with a wavelength of 3.6 microns has been colour coded blue; 4.5-micron light is blue-green; 5.8-micron and 8.0-micron light are green; and 24-micron light is red.
许可协议
[编辑]
| 本文件完全由NASA创作,在美国属于公有领域。根据NASA的版权方针,NASA的材料除非另有声明否则不受版权保护。(参见Template:PD-USGov/zh、NASA版权方针页面或JPL图片使用方针。) | ||
 |
警告:
|
| 注解 | 该图片含有注解:在维基媒体共享资源上查看注解 |
文件历史
点击某个日期/时间查看对应时刻的文件。
| 日期/时间 | 缩略图 | 大小 | 用户 | 备注 | |
|---|---|---|---|---|---|
| 当前 | 2011年2月16日 (三) 12:09 | | 6,000 × 6,003(16.93 MB) | Originalwana(留言 | 贡献) | {{Information |Description ={{en|1=This image layout reveals how the appearance of the North America nebula can change dramatically using different combinations of visible and infrared observations from the [[:Category:Digitized |
您不可以覆盖此文件。
文件用途
以下2个页面使用本文件:
全域文件用途
以下其他wiki使用此文件:
- ar.wikipedia.org上的用途
- cs.wikipedia.org上的用途
- fr.wikipedia.org上的用途
- mk.wikipedia.org上的用途
- my.wikipedia.org上的用途
- pl.wikipedia.org上的用途
- pt.wikipedia.org上的用途
- th.wikipedia.org上的用途
- vi.wikipedia.org上的用途
- zh.wikipedia.org上的用途