File:ClimateDashboard-global-sea-levels-graph-20230329-1400px.png
跳至導覽
跳至搜尋
預覽大小:700 × 600 像素。 其他解析度:280 × 240 像素 | 560 × 480 像素 | 896 × 768 像素 | 1,195 × 1,024 像素 | 1,400 × 1,200 像素。
原始檔案 (1,400 × 1,200 像素,檔案大小:88 KB,MIME 類型:image/png)
說明
說明
添加單行說明來描述出檔案所代表的內容
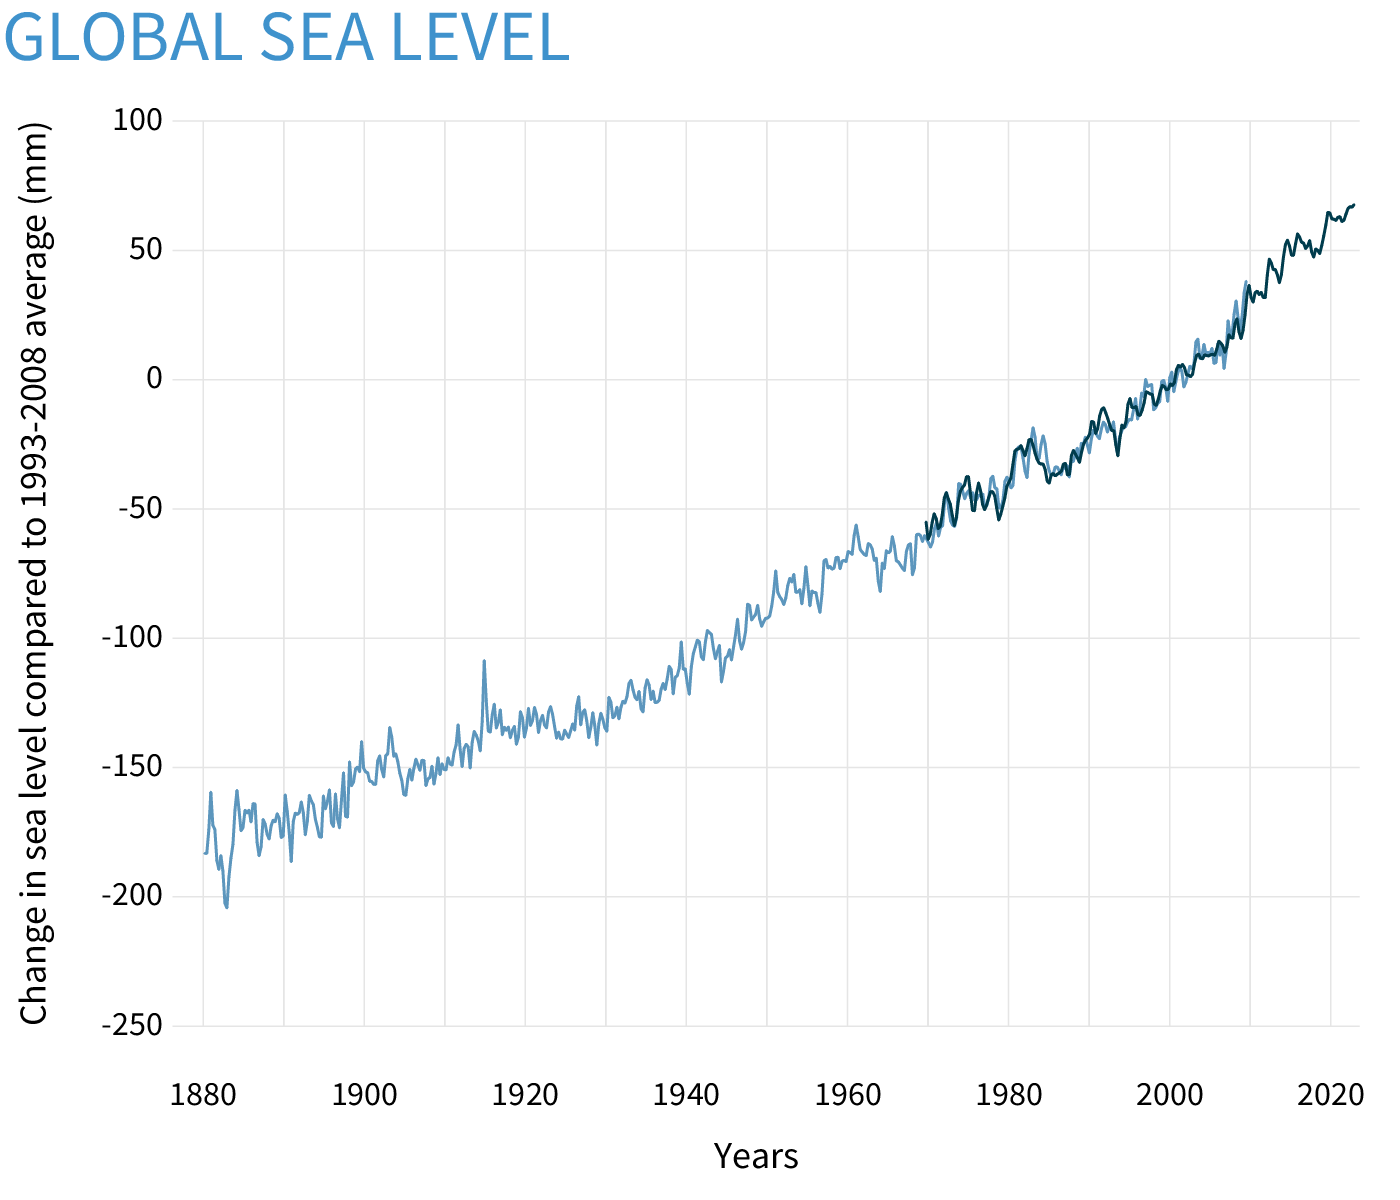
Global sea level rise estimates between 1880 and 2021
摘要[編輯]
| 描述 |
English: Seasonal (3-month) sea level estimates from Church and White (2011) (light blue line) and University of Hawaii Fast Delivery sea level data (dark blue). The values are shown as change in sea level in millimeters compared to the 1993-2008 average. NOAA Climate.gov image based on analysis and data from Philip Thompson, University of Hawaii Sea Level Center.
Church, J. A., and White, N. J. (2011). Sea-Level Rise from the Late 19th to the Early 21st Century. Surveys in Geophysics, 32(4-5), 585–602. http://doi.org/10.1007/s10712-011-9119-1 |
| 日期 | |
| 來源 | https://www.climate.gov/news-features/understanding-climate/climate-change-global-sea-level |
| 作者 | NOAA |
Related file[編輯]
-
 1880- Global average sea level rise (SLR) - annually.svg —
SVG from EPA data through 2021
_-_annually.svg)
授權條款[編輯]
本圖像屬於公有領域,因該作品最初來自於美國國家海洋和大氣管理局職員的職務作品。
|
檔案歷史
點選日期/時間以檢視該時間的檔案版本。
| 日期/時間 | 縮圖 | 尺寸 | 用戶 | 備註 | |
|---|---|---|---|---|---|
| 目前 | 2023年4月25日 (二) 17:12 | | 1,400 × 1,200(88 KB) | Femke(對話 | 貢獻) | Uploaded a work by NOAA from https://www.climate.gov/news-features/understanding-climate/climate-change-global-sea-level with UploadWizard |
無法覆蓋此檔案。
檔案用途
_-_annually.svg)
全域檔案使用狀況
以下其他 wiki 使用了這個檔案:
- en.wikipedia.org 的使用狀況
- pt.wikipedia.org 的使用狀況
- zh.wikipedia.org 的使用狀況