File:Correlation examples.png
跳转到导航
跳转到搜索

本预览的尺寸:800 × 336像素。 其他分辨率:320 × 134像素 | 824 × 346像素。
原始文件 (824 × 346像素,文件大小:15 KB,MIME类型:image/png)
说明
说明
添加一行文字以描述该文件所表现的内容
| 描述 | See below. |
| 日期 | 2007年12月8日 (原始上传日期) |
| 来源 |
Transferred from en.wikipedia to Commons by jtneill. 本PNG 位图使用Mathematica创作。 |
| 作者 | 英语维基百科的Imagecreator |
| 其他版本 | File:CovrarianceCorrelation.svg, File:Correlation examples2.svg |

|
File:Correlation examples2.svg是此文件的矢量版本。 如果此文件质量不低于原点阵图,就应该将这个PNG格式文件替换为此文件。
File:Correlation examples.png → File:Correlation examples2.svg
更多信息请参阅Help:SVG/zh。 |
 |
|
|
[[:File:CovrarianceCorrelaخن
tion.svg]]是此文件的矢量版本。
错误:以此命名的SVG图片不存在。请确保格式正确:{{Vector version available|新图片名称}}。 File:Correlation examples.png → [[:File:CovrarianceCorrelaخن
tion.svg]]
更多信息请参阅Help:SVG/zh。 |
[[File:CovrarianceCorrelaخن
tion.svg|新SVG图片|150x150px]] |
摘要
[编辑]
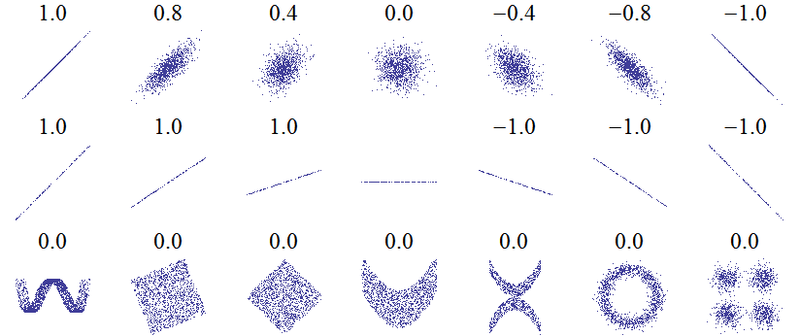
An example of the correlation of x and y for various distributions of (x,y) pairs. It was created by this Mathematica 6 code, which I wrote and release into the public domain (needs makePlot!):
n = 2000;
GraphicsArray[{
  Table[makePlot[
    Table[{RandomReal[NormalDistribution[0, 1]], (1 - Abs[w])*
        RandomReal[NormalDistribution[0, 1]]} .
      RotationMatrix[-Sign[w]*Pi/4], {i, -1, 1, 2./n}], 1000], {w,
    1, -1, -1/3}],
  Table[makePlot[Table[{x, slope*x}, {x, -1, 1, 2./n}], 100], {slope,
    1, -1, -1/3}],
  {
   makePlot[
    Table[{x + RandomReal[]/3,
      4 (x^2 - 1/2)^2 + RandomReal[]/500} , {x, -1, 1, 2./n}], 2000],
   makePlot[
    Table[{RandomReal[{-1, 1}], RandomReal[{-1, 1}]} .
      RotationMatrix[-Pi/8], {x, -1, 1, 2./n}], 1400],
   makePlot[
    Table[{RandomReal[{-1, 1}], RandomReal[{-1, 1}]} .
      RotationMatrix[-Pi/4], {x, -1, 1, 2./n}], 1400],
   makePlot[Table[{x, x^2 + RandomReal[]}/2, {x, -1, 1, 2./n}],
    1400],
   makePlot[
    Table[{x, x^2 + RandomReal[]/2}*(RandomInteger[1]*2 - 1), {x, -1,
      1, 2./n}], 1000],
   makePlot[
    Table[{Sin[x*Pi] + RandomReal[NormalDistribution[0, 1/8]],
      Cos[x*Pi] + RandomReal[NormalDistribution[0, 1/8]]}, {x, -1, 1,
      2./n}], 1400],
   makePlot[
    Table[{RandomReal[NormalDistribution[0, 1/3]],
       RandomReal[
        NormalDistribution[0, 1/3]]} + {RandomInteger[1]*2 - 1,
       RandomInteger[1]*2 - 1}, {x, -1, 1, 2./n}], 1400]
   }
  }]
许可协议
[编辑]
| 本作品已被作者英语维基百科的Imagecreator释出到公有领域。这适用于全世界。 在一些国家这可能不合法;如果是这样的话,那么: Imagecreator无条件地授予任何人以任何目的使用本作品的权利,除非这些条件是法律规定所必需的。 |
原始上传日志
[编辑]
The original description page was here. All following user names refer to en.wikipedia.
- 2007-12-08 19:16 Imagecreator 824×346×8 (20371 bytes) == Summary == An example of the correlation of x and y for various distributions of (x,y) pairs. It was created by this Mathematica 6 code, which I wrote and release into the public domain: <pre> (*Several sets of (x,y) points, with the correlation coef
- 2007-12-08 18:48 Imagecreator 824×346×8 (21374 bytes) An example of the correlation of x and y for various distributions of (x,y) pairs. It was created by this Mathematica 6 code, which I wrote and release into the public domain: (*Several sets of (x,y) points, with the correlation coefficient of x \ and y
文件历史
点击某个日期/时间查看对应时刻的文件。
| 日期/时间 | 缩略图 | 大小 | 用户 | 备注 | |
|---|---|---|---|---|---|
| 当前 | 2010年2月2日 (二) 09:33 | | 824 × 346(15 KB) | JBW(留言 | 贡献) | Removing "0.0" for correlation coefficient from horizontal line: here corr. coeff. is undefined. |
| 2008年3月18日 (二) 10:27 |  | 824 × 346(20 KB) | Jtneill(留言 | 贡献) | {{Information |Description={{en|An example of the correlation of x and y for various distributions of (x,y) pairs. It was created by this Mathematica 6 code, which I wrote and release into the public domain: n = 2000; GraphicsArray[{ Table[makePlot[ |
您不可以覆盖此文件。
文件用途
没有页面使用本文件。
全域文件用途
以下其他wiki使用此文件:
- ar.wikipedia.org上的用途
- bg.wikipedia.org上的用途
- de.wikipedia.org上的用途
- de.wikibooks.org上的用途
- Mathematrix: AT BRP/ Theorie/ Reifeniveau 6
- Mathematrix: MA TER/ Theorie/ Statistik und Wahrscheinlichkeitsrechnung
- Mathematrix: AT BRP/ Theorie nach Thema/ Statistik und Wahrscheinlichkeitsrechnung
- Mathematrix: AT AHS/ Theorie nach Thema/ Statistik und Wahrscheinlichkeitsrechnung
- Mathematrix: BY GYM/ Theorie nach Thema/ Statistik und Wahrscheinlichkeitsrechnung
- en.wikipedia.org上的用途
- hi.wikipedia.org上的用途
- it.wikipedia.org上的用途
- lt.wikipedia.org上的用途
- pl.wikipedia.org上的用途
- th.wikipedia.org上的用途
- tr.wikipedia.org上的用途