File:Correlation examples2.svg
跳去導覽
跳去搵嘢

呢個「SVG」檔案嘅呢個「PNG」預覽嘅大細:506 × 231 像素。 第啲解像度:320 × 146 像素 | 640 × 292 像素 | 1,024 × 467 像素 | 1,280 × 584 像素 | 2,560 × 1,169 像素。
原本檔案 (SVG檔案,表面大細: 506 × 231 像素,檔案大細:2.18 MB)
Captions
Captions
Add a one-line explanation of what this file represents
OVRHEAD AN D REVENUE
摘要[編輯]
| 描述 |
English: redesign File:Correlation_examples.png using vector graphics (SVG file) |
| 日期 | |
| 來源 | 自己作品, original uploader was Imagecreator |
| 作者 | DenisBoigelot, original uploader was Imagecreator |
| 許可 (重用呢個檔案) |
Released into the public domain (by the authors). |
| Other versions |
Derivative works of this file: CovrarianceCorrelation.svg File:Correlation_examples.png |
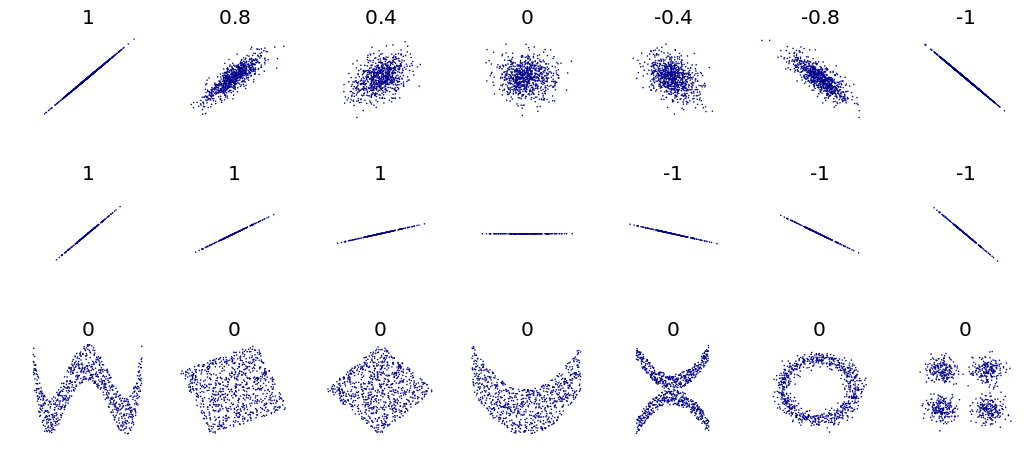
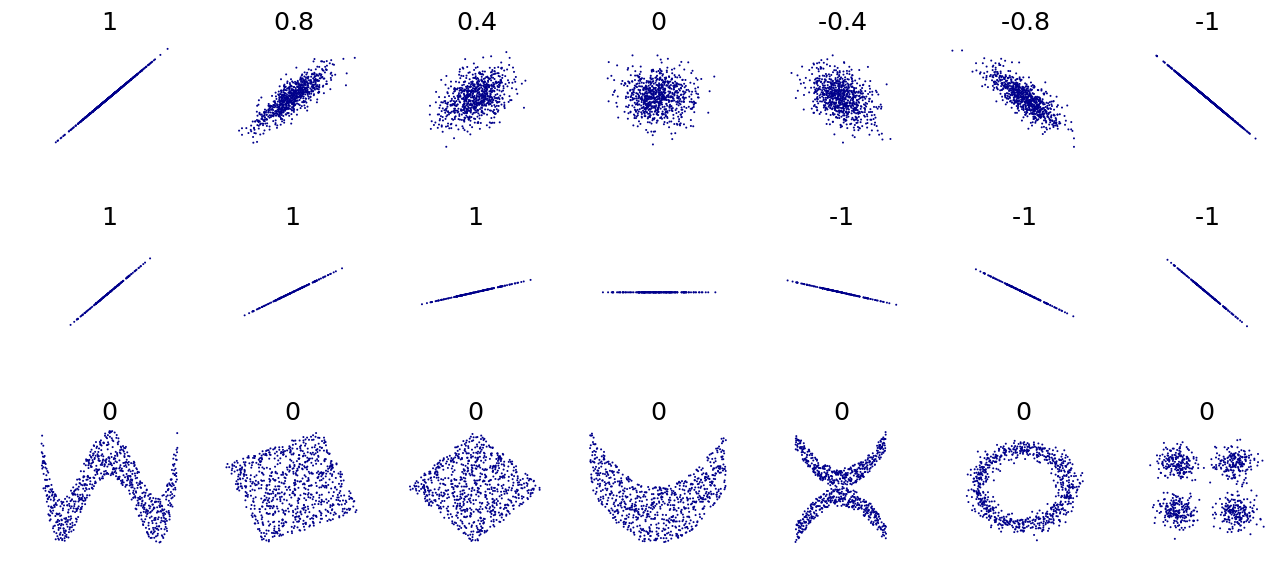
#Title: An example of the correlation of x and y for various distributions of (x,y) pairs
#Tags: Mathematics; Statistics; Correlation
#Author: Denis Boigelot
#Packets needed : mvtnorm (rmvnorm), RSVGTipsDevice (devSVGTips)
#How to use: output()
#
#This is an translated version in R of an Matematica 6 code by Imagecreator.

library(mvtnorm)
library(RSVGTipsDevice)

MyPlot <- function(xy, xlim = c(-4, 4), ylim = c(-4, 4), eps = 1e-15) {
   title = round(cor(xy[,1], xy[,2]), 1)
   if (sd(xy[,2]) < eps) title = "" # corr. coeff. is undefined
   plot(xy, main = title, xlab = "", ylab = "",
        col = "darkblue", pch = 16, cex = 0.2,
        xaxt = "n", yaxt = "n", bty = "n",
        xlim = xlim, ylim = ylim)
}

MvNormal <- function(n = 1000, cor = 0.8) {
   for (i in cor) {
      sd = matrix(c(1, i, i, 1), ncol = 2)
      x = rmvnorm(n, c(0, 0), sd)
      MyPlot(x)
   }
}

rotation <- function(t, X) return(X %*% matrix(c(cos(t), sin(t), -sin(t), cos(t)), ncol = 2))

RotNormal <- function(n = 1000, t = pi/2) {
   sd = matrix(c(1, 1, 1, 1), ncol = 2)
   x = rmvnorm(n, c(0, 0), sd)
   for (i in t)
      MyPlot(rotation(i, x))
}

Others <- function(n = 1000) {
   x = runif(n, -1, 1)
   y = 4 * (x^2 - 1/2)^2 + runif(n, -1, 1)/3
   MyPlot(cbind(x,y), xlim = c(-1, 1), ylim = c(-1/3, 1+1/3))

   y = runif(n, -1, 1)
   xy = rotation(-pi/8, cbind(x,y))
   lim = sqrt(2+sqrt(2)) / sqrt(2)
   MyPlot(xy, xlim = c(-lim, lim), ylim = c(-lim, lim))

   xy = rotation(-pi/8, xy)
   MyPlot(xy, xlim = c(-sqrt(2), sqrt(2)), ylim = c(-sqrt(2), sqrt(2)))

   y = 2*x^2 + runif(n, -1, 1)
   MyPlot(cbind(x,y), xlim = c(-1, 1), ylim = c(-1, 3))

   y = (x^2 + runif(n, 0, 1/2)) * sample(seq(-1, 1, 2), n, replace = TRUE)
   MyPlot(cbind(x,y), xlim = c(-1.5, 1.5), ylim = c(-1.5, 1.5))

   y = cos(x*pi) + rnorm(n, 0, 1/8)
   x = sin(x*pi) + rnorm(n, 0, 1/8)
   MyPlot(cbind(x,y), xlim = c(-1.5, 1.5), ylim = c(-1.5, 1.5))

   xy1 = rmvnorm(n/4, c( 3,  3))
   xy2 = rmvnorm(n/4, c(-3,  3))
   xy3 = rmvnorm(n/4, c(-3, -3))
   xy4 = rmvnorm(n/4, c( 3, -3))
   MyPlot(rbind(xy1, xy2, xy3, xy4), xlim = c(-3-4, 3+4), ylim = c(-3-4, 3+4))
}

output <- function() {
   devSVGTips(width = 7, height = 3.2) # remove first and last line for no svg exporting
   par(mfrow = c(3, 7), oma = c(0,0,0,0), mar=c(2,2,2,0))
   MvNormal(800, c(1.0, 0.8, 0.4, 0.0, -0.4, -0.8, -1.0));
   RotNormal(200, c(0, pi/12, pi/6, pi/4, pi/2-pi/6, pi/2-pi/12, pi/2));
   Others(800)
   dev.off() # remove first and last line for no svg exporting
}
協議[編輯]
我,呢份作品嘅作者,決定用以下許可發佈呢件作品:
| This file is made available under the Creative Commons CC0 1.0 Universal Public Domain Dedication. | |
| The person who associated a work with this deed has dedicated the work to the public domain by waiving all of their rights to the work worldwide under copyright law, including all related and neighboring rights, to the extent allowed by law. You can copy, modify, distribute and perform the work, even for commercial purposes, all without asking permission.
|
檔案歷史
撳個日期/時間去睇響嗰個時間出現過嘅檔案。
| 日期/時間 | 縮圖 | 尺寸 | 用戶 | 註解 | |
|---|---|---|---|---|---|
| 現時 | 2011年5月10號 (二) 06:00 | | 506 × 231(2.18 MB) | DenisBoigelot(傾偈 | 貢獻) | {{Information |Description ={{en|1=fd}} |Source ={{own}} |Author =DenisBoigelot |Date = |Permission = |other_versions = }} fjdk |
你無得衾咗個檔案。
檔案用途
全域檔案使用情況
下面嘅維基都用緊呢個檔案:
- ast.wikipedia.org嘅使用情況
- as.wikipedia.org嘅使用情況
- be.wikipedia.org嘅使用情況
- bn.wikipedia.org嘅使用情況
- bs.wikipedia.org嘅使用情況
- ca.wikipedia.org嘅使用情況
- cs.wikipedia.org嘅使用情況
- el.wikipedia.org嘅使用情況
- en.wikipedia.org嘅使用情況
- en.wikiversity.org嘅使用情況
- en.wiktionary.org嘅使用情況
- es.wikipedia.org嘅使用情況
- fa.wikipedia.org嘅使用情況
- fi.wikipedia.org嘅使用情況
- fi.wiktionary.org嘅使用情況
- fr.wikipedia.org嘅使用情況
- ga.wikipedia.org嘅使用情況
- ja.wikipedia.org嘅使用情況
- jv.wikipedia.org嘅使用情況
- ko.wikipedia.org嘅使用情況
- pt.wikipedia.org嘅使用情況
- ru.wikipedia.org嘅使用情況
- sl.wikipedia.org嘅使用情況
- sr.wikipedia.org嘅使用情況
- sv.wikipedia.org嘅使用情況
- tl.wikipedia.org嘅使用情況
- uk.wikipedia.org嘅使用情況
- www.wikidata.org嘅使用情況
- zh-yue.wikipedia.org嘅使用情況
- zh.wikipedia.org嘅使用情況