File:Correlation examples2.svg
跳至導覽
跳至搜尋

此 SVG 檔案的 PNG 預覽的大小:506 × 231 像素。 其他解析度:320 × 146 像素 | 640 × 292 像素 | 1,024 × 467 像素 | 1,280 × 584 像素 | 2,560 × 1,169 像素。
原始檔案 (SVG 檔案,表面大小:506 × 231 像素,檔案大小:2.18 MB)
說明
說明
添加單行說明來描述出檔案所代表的內容
OVRHEAD AN D REVENUE
摘要
[編輯]
| 描述 |
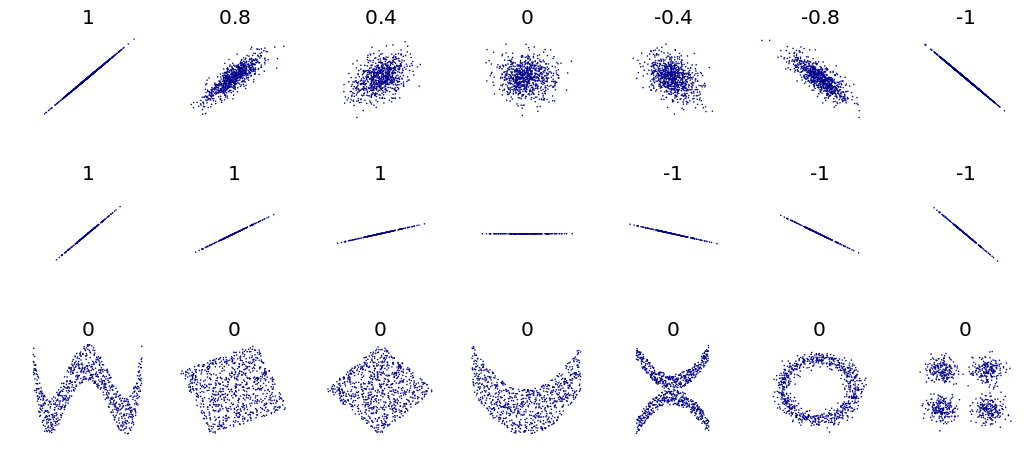
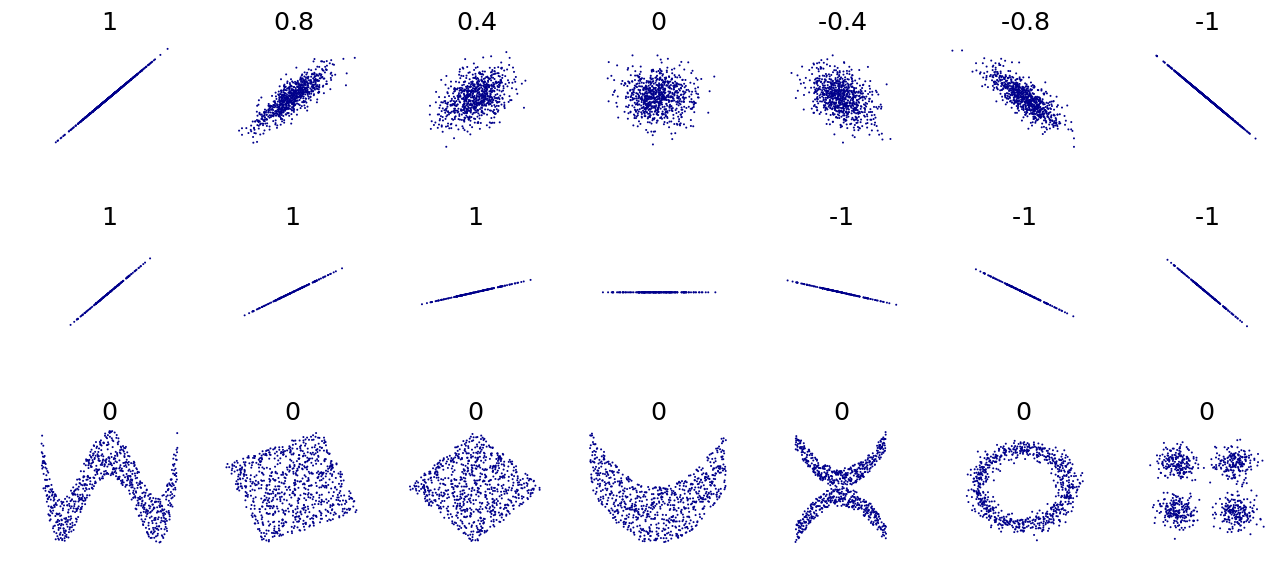
English: redesign File:Correlation_examples.png using vector graphics (SVG file) |
| 日期 | |
| 來源 | 自己的作品, original uploader was Imagecreator |
| 作者 | DenisBoigelot, original uploader was Imagecreator |
| 授權許可 (重用此檔案) |
Released into the public domain (by the authors). |
| 其他版本 |
此檔案衍生的作品: CovrarianceCorrelation.svg File:Correlation_examples.png |
#Title: An example of the correlation of x and y for various distributions of (x,y) pairs
#Tags: Mathematics; Statistics; Correlation
#Author: Denis Boigelot
#Packets needed : mvtnorm (rmvnorm), RSVGTipsDevice (devSVGTips)
#How to use: output()
#
#This is an translated version in R of an Matematica 6 code by Imagecreator.

library(mvtnorm)
library(RSVGTipsDevice)

MyPlot <- function(xy, xlim = c(-4, 4), ylim = c(-4, 4), eps = 1e-15) {
   title = round(cor(xy[,1], xy[,2]), 1)
   if (sd(xy[,2]) < eps) title = "" # corr. coeff. is undefined
   plot(xy, main = title, xlab = "", ylab = "",
        col = "darkblue", pch = 16, cex = 0.2,
        xaxt = "n", yaxt = "n", bty = "n",
        xlim = xlim, ylim = ylim)
}

MvNormal <- function(n = 1000, cor = 0.8) {
   for (i in cor) {
      sd = matrix(c(1, i, i, 1), ncol = 2)
      x = rmvnorm(n, c(0, 0), sd)
      MyPlot(x)
   }
}

rotation <- function(t, X) return(X %*% matrix(c(cos(t), sin(t), -sin(t), cos(t)), ncol = 2))

RotNormal <- function(n = 1000, t = pi/2) {
   sd = matrix(c(1, 1, 1, 1), ncol = 2)
   x = rmvnorm(n, c(0, 0), sd)
   for (i in t)
      MyPlot(rotation(i, x))
}

Others <- function(n = 1000) {
   x = runif(n, -1, 1)
   y = 4 * (x^2 - 1/2)^2 + runif(n, -1, 1)/3
   MyPlot(cbind(x,y), xlim = c(-1, 1), ylim = c(-1/3, 1+1/3))

   y = runif(n, -1, 1)
   xy = rotation(-pi/8, cbind(x,y))
   lim = sqrt(2+sqrt(2)) / sqrt(2)
   MyPlot(xy, xlim = c(-lim, lim), ylim = c(-lim, lim))

   xy = rotation(-pi/8, xy)
   MyPlot(xy, xlim = c(-sqrt(2), sqrt(2)), ylim = c(-sqrt(2), sqrt(2)))

   y = 2*x^2 + runif(n, -1, 1)
   MyPlot(cbind(x,y), xlim = c(-1, 1), ylim = c(-1, 3))

   y = (x^2 + runif(n, 0, 1/2)) * sample(seq(-1, 1, 2), n, replace = TRUE)
   MyPlot(cbind(x,y), xlim = c(-1.5, 1.5), ylim = c(-1.5, 1.5))

   y = cos(x*pi) + rnorm(n, 0, 1/8)
   x = sin(x*pi) + rnorm(n, 0, 1/8)
   MyPlot(cbind(x,y), xlim = c(-1.5, 1.5), ylim = c(-1.5, 1.5))

   xy1 = rmvnorm(n/4, c( 3,  3))
   xy2 = rmvnorm(n/4, c(-3,  3))
   xy3 = rmvnorm(n/4, c(-3, -3))
   xy4 = rmvnorm(n/4, c( 3, -3))
   MyPlot(rbind(xy1, xy2, xy3, xy4), xlim = c(-3-4, 3+4), ylim = c(-3-4, 3+4))
}

output <- function() {
   devSVGTips(width = 7, height = 3.2) # remove first and last line for no svg exporting
   par(mfrow = c(3, 7), oma = c(0,0,0,0), mar=c(2,2,2,0))
   MvNormal(800, c(1.0, 0.8, 0.4, 0.0, -0.4, -0.8, -1.0));
   RotNormal(200, c(0, pi/12, pi/6, pi/4, pi/2-pi/6, pi/2-pi/12, pi/2));
   Others(800)
   dev.off() # remove first and last line for no svg exporting
}
授權條款
[編輯]
我,本作品的著作權持有者,決定用以下授權條款發佈本作品:
| 此檔案在創用CC CC0 1.0 通用公有領域貢獻宣告之下分發。 | |
| 在此宣告之下分發本作品者,已依據各國著作權法,在全世界放棄其對本作品所擁有的著作權及所有相關相似的法律權利,從而將本作品貢獻至公有領域。您可以複製、修改、分發和演示該作品,用於任何商業用途,所有這些都不需要請求授權。
|
檔案歷史
點選日期/時間以檢視該時間的檔案版本。
| 日期/時間 | 縮圖 | 尺寸 | 使用者 | 備註 | |
|---|---|---|---|---|---|
| 目前 | 2011年5月10日 (二) 06:00 | | 506 × 231(2.18 MB) | DenisBoigelot(留言 | 貢獻) | {{Information |Description ={{en|1=fd}} |Source ={{own}} |Author =DenisBoigelot |Date = |Permission = |other_versions = }} fjdk |
無法覆蓋此檔案。
檔案用途
全域檔案使用狀況
以下其他 wiki 使用了這個檔案:
- ast.wikipedia.org 的使用狀況
- as.wikipedia.org 的使用狀況
- be.wikipedia.org 的使用狀況
- bh.wikipedia.org 的使用狀況
- bn.wikipedia.org 的使用狀況
- bs.wikipedia.org 的使用狀況
- ca.wikipedia.org 的使用狀況
- cs.wikipedia.org 的使用狀況
- el.wikipedia.org 的使用狀況
- en.wikipedia.org 的使用狀況
- en.wikiversity.org 的使用狀況
- en.wiktionary.org 的使用狀況
- es.wikipedia.org 的使用狀況
- fa.wikipedia.org 的使用狀況
- fi.wikipedia.org 的使用狀況
- fi.wiktionary.org 的使用狀況
- fr.wikipedia.org 的使用狀況
- ga.wikipedia.org 的使用狀況
- ja.wikipedia.org 的使用狀況
- jv.wikipedia.org 的使用狀況
- ko.wikipedia.org 的使用狀況
- pt.wikipedia.org 的使用狀況
- ru.wikipedia.org 的使用狀況
- sl.wikipedia.org 的使用狀況
- sr.wikipedia.org 的使用狀況
- sv.wikipedia.org 的使用狀況
- tl.wikipedia.org 的使用狀況
- uk.wikipedia.org 的使用狀況
- www.wikidata.org 的使用狀況
- zh-yue.wikipedia.org 的使用狀況
- zh.wikipedia.org 的使用狀況