File:Countries by Human Development Index (2019).png
跳至導覽
跳至搜尋

預覽大小:800 × 361 像素。 其他解析度:320 × 145 像素 | 640 × 289 像素 | 1,024 × 462 像素 | 1,280 × 578 像素 | 2,560 × 1,156 像素 | 6,060 × 2,737 像素。
原始檔案 (6,060 × 2,737 像素,檔案大小:1.49 MB,MIME 類型:image/png)
說明
說明
添加單行說明來描述出檔案所代表的內容
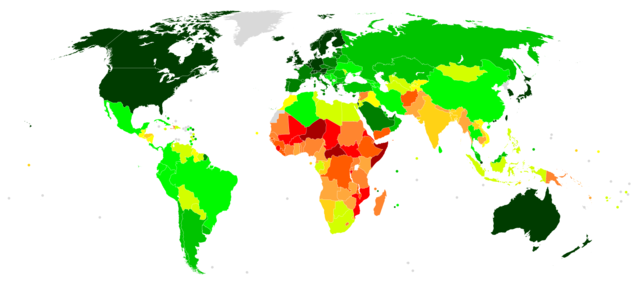
The map geographically presenting the Human Development Index (HDI) which is a statistic composite index of life expectancy, education, and per capita income indicators
摘要[編輯]
.png&action=edit§ion=1)
| 描述 |
English: A choropleth map showing countries and territories by Human Development Index, based on 2018 data from the 2019 Human Development Report. Data for Macau is calculated by the Government of Macau, published in 2019, showing 2017 data, while data for Taiwan is calculated by the Government of Taiwan, published in 2019, showing 2017 data. 2017 data is shown for Somalia according to Global Data Lab.
≥ 0.900
0.850–0.899
0.800–0.849
0.750–0.799
0.700–0.749
0.650–0.699
0.600–0.649
0.550–0.599
0.500–0.549
0.450–0.499
0.400–0.449
≤ 0.399
Data unavailable |
| 日期 | |
| 來源 | 自己的作品 |
| 作者 | JackintheBox |
授權條款[編輯]
.png&action=edit§ion=2)
| 此地圖不符合著作權的資格,因此屬於公有領域,因為其完全包含公共財產資訊,不包含原作者身份。詳情參見Commons:Threshold of originality § Maps。
|
檔案歷史
點選日期/時間以檢視該時間的檔案版本。
| 日期/時間 | 縮圖 | 尺寸 | 使用者 | 備註 | |
|---|---|---|---|---|---|
| 目前 | 2019年12月10日 (二) 12:43 | | 6,060 × 2,737(1.49 MB) | JackintheBox(留言 | 貢獻) | {{Information |description ={{en|1=A choropleth map showing countries and territories by Human Development Index, based on 2018 data from the [http://hdr.undp.org/sites/default/files/hdr_2019_overview_-_english.pdf 2019 Human Development Report]. Data for Macau is calculated by the [https://www.dsec.gov.mo/getAttachment/5c26bbdf-77c7-48aa-bb1f-a1537a2b220d/E_MN_PUB_2018_Y.aspx Government of Macau], published in 2019, showing 2017 data, while data for Taiwan is calculated by the [http://eng.... |
無法覆蓋此檔案。
檔案用途
沒有使用此檔案的頁面。
全域檔案使用狀況
以下其他 wiki 使用了這個檔案:
- de.wikipedia.org 的使用狀況
- id.wikipedia.org 的使用狀況
- zh.wikipedia.org 的使用狀況
.png&oldid=870105532)