File:Dandelion clock quarter dft dct.png

元のファイル (1,140 × 1,428 ピクセル、ファイルサイズ: 542キロバイト、MIME タイプ: image/png)
キャプション
キャプション
概要[編集]
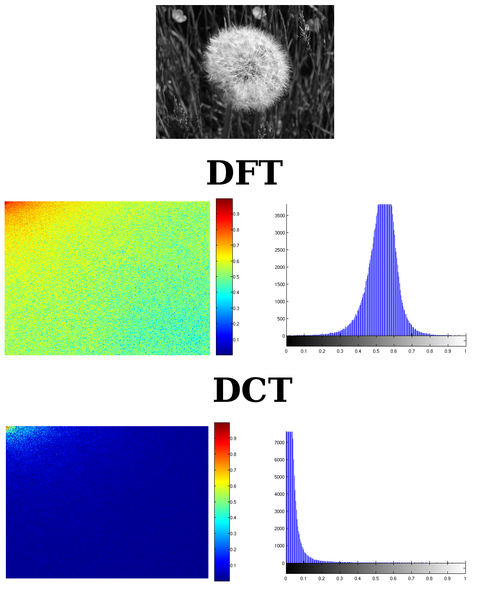
| 解説 | the picture shows the difference between the DFT and a DCT of an image |
| 日付 | |
| 原典 | I made it by myself |
| 作者 | Alessio Damato |
| 許可 (ファイルの再利用) |
multilicensed (see below) |
| その他のバージョン | the original image that was processed was Image:Dandelion_clock.jpg |
I used Image:Dandelion_clock.jpg to create this image. I wanted to show clearly the different behavior between the DFT and the DCT in the frequency domain.
The pictures are made of other figures. The first one on the top is just the original image: I used its gray-scale version. On the second line there is the DFT: its magnitude on the left, its histogram on the right. On the third line there is the DCT, with both magnitude and histogram.
The spectrum of the DFT has cropped so that the lowest frequencies are on the top-left of the picture, just like in the DCT. It is not such a rigorous process: the DFT in general is composed of two symmetric halves, but I put on the picture just one quarter, thus removing one quarter of necessary information. I did so to create an output that could be easily be compared with the DCT. Because of symmetry, I cropped to 1/4 the DCT as well, keeping the lower frequencies. Anyway it is clear how the DCT concentrates most of the energy into the lowest frequencies.
I created the single images with the following Matlab code:
% read the image
RGB = imread('Dandelion_clock.jpg');
% convert pixels to the [0 1] range
RGB = im2double(RGB);
% convert to grayscale
I = rgb2gray(RGB);

% calculate the size of the image and then divide
% by two, in order to crop it later
[X Y] = size(I);
Y = round(Y/2);
X = round(X/2);

% evaluate magnitude of the DFT
F = abs(fft2(I));
% take only a quarter
F = imcrop(F,[0 0 Y X]);
% use log scale
F = log(1 + F);
F = log(1 + F);
% normalize
F = F/max(F(:));

% evaluate magnitude of the DCT
C = abs(dct2(I));
% take only a quarter
C = imcrop(C,[0 0 Y X]);
% use log scale
C = log(1 + C);
C = log(1 + C);
% normalize
C = C/max(C(:));

% show all the results
imshow(F), colorbar, colormap(jet);
figure, imhist(F);
figure, imshow(C), colorbar, colormap(jet);
figure, imhist(C);
First it imports the RGB image and converts it to gray-scale. Then calculates the magnitude of both the transforms. Both pictures had a huge dynamic, so I calculated the logarithm of both, twice, in order to be able to show the transforms properly. Once all the pictures were shown on the screen, I just selected File -> Save as on Matlab to save all the pictures. I put them all together using Gimp.
(comment by RCL) I cant speak english very well, but I'm going to try it. The use of this code it's WRONG, we can't use this MATLAB code for comparing both transforms, because in MATLAB the definition of the DFT isn't normalized and the definition of the DCT in MATLB it's normalized. So we should multiply the result of the fft by a factor of 1.0/N², before we use the function abs. The result between the DFT and the DCT is very similar if we do this, but we can obtain the shannon entropy of the energy of both transforms and the result is that the entropy of the energy in the DCT is lower than the DFT, for that reason we say that the DCT compact the energy more than the DFT. I made my master thesis on the DCT.
ライセンス[編集]

|
この文書は、フリーソフトウェア財団発行のGNUフリー文書利用許諾書 (GNU Free Documentation License) 1.2またはそれ以降のバージョンの規約に基づき、複製や再配布、改変が許可されます。不可変更部分、表紙、背表紙はありません。このライセンスの複製は、GNUフリー文書利用許諾書という章に含まれています。 |
| このファイルはクリエイティブ・コモンズ 表示-継承 3.0 非移植ライセンスのもとに利用を許諾されています。 | ||
| ||
| このライセンスのテンプレートは、GFDLのライセンス・アップデートによりこのファイルに追加されたものです。 |
- あなたは以下の条件に従う場合に限り、自由に
- 共有 – 本作品を複製、頒布、展示、実演できます。
- 再構成 – 二次的著作物を作成できます。
- あなたの従うべき条件は以下の通りです。
- 表示 – あなたは適切なクレジットを表示し、ライセンスへのリンクを提供し、変更があったらその旨を示さなければなりません。これらは合理的であればどのような方法で行っても構いませんが、許諾者があなたやあなたの利用行為を支持していると示唆するような方法は除きます。
- 継承 – もしあなたがこの作品をリミックスしたり、改変したり、加工した場合には、あなたはあなたの貢献部分を元の作品とこれと同一または互換性があるライセンスの下に頒布しなければなりません。
ファイルの履歴
過去の版のファイルを表示するには、その版の日時をクリックしてください。
| 日付と時刻 | サムネイル | 寸法 | 利用者 | コメント | |
|---|---|---|---|---|---|
| 現在の版 | 2006年5月13日 (土) 18:50 | | 1,140 × 1,428 (542キロバイト) | Alejo2083 (トーク | 投稿記録) | == Summary == {{Information| |Description= the picture shows the difference between the DFT and a DCT of an image |Source= I made it by myself |Date= 13/05/2006 |Author= Alessio Damato |Permission= multilicensed (see below) |other_versions= the original |
このファイルは上書きできません。
ファイルの使用状況
このファイルを使用しているページはありません。
グローバルなファイル使用状況
以下に挙げる他のウィキがこの画像を使っています:
- ar.wikipedia.org での使用状況
- ca.wikipedia.org での使用状況
- cs.wikipedia.org での使用状況
- es.wikipedia.org での使用状況
- eu.wikipedia.org での使用状況
- it.wikipedia.org での使用状況
- ja.wikipedia.org での使用状況
- pt.wikipedia.org での使用状況
- zh.wikipedia.org での使用状況