File:Deforestation-emissions-in-trade-–-Sankey-01.png
原始檔案 (1,493 × 1,714 像素,檔案大小:207 KB,MIME 類型:image/png)
說明
說明
摘要
[編輯]
| 描述 |
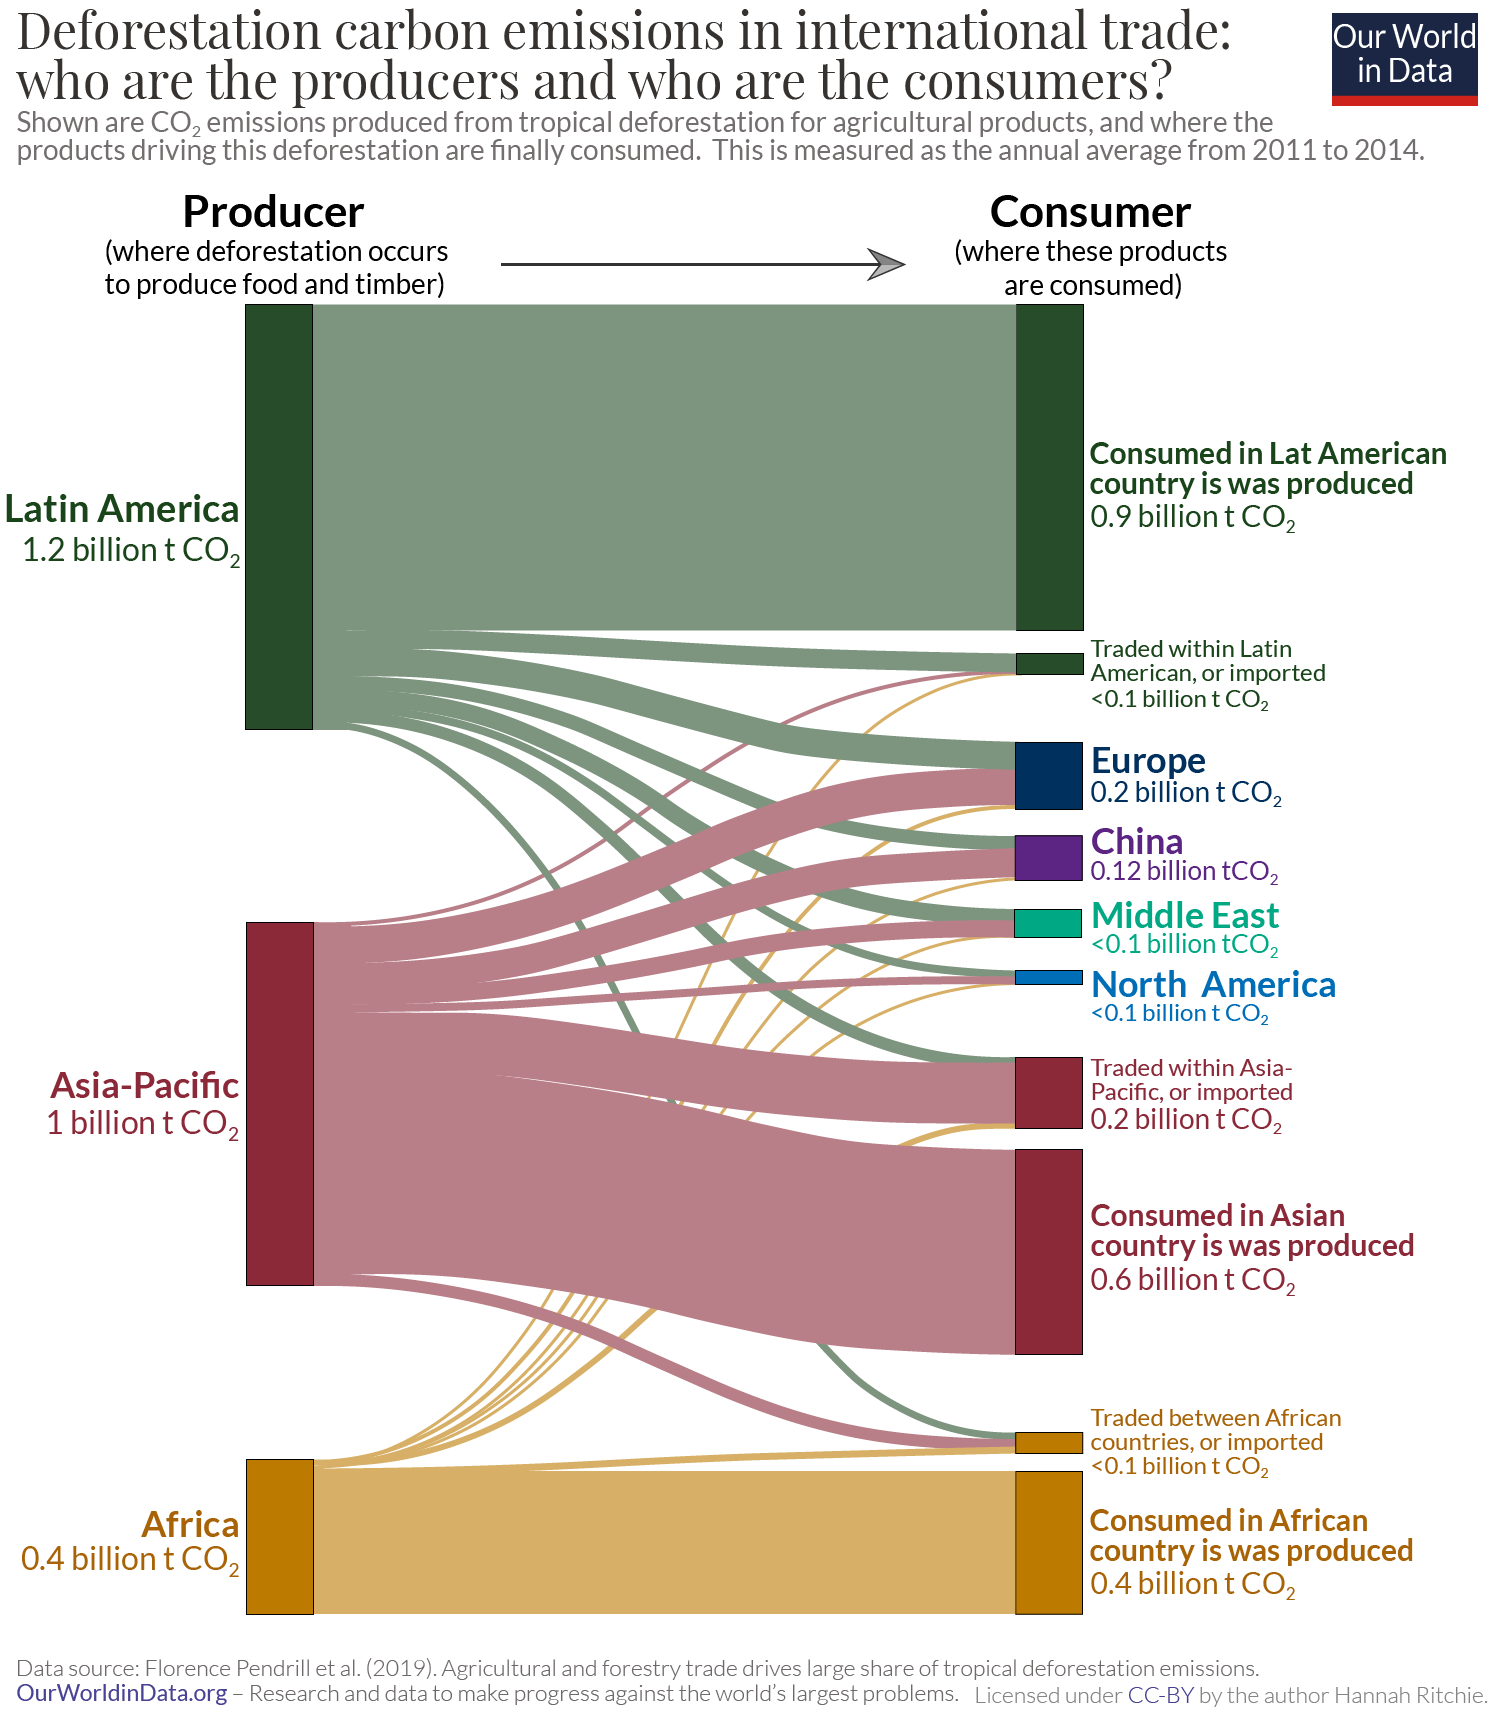
English: One-third of CO2 emissions from deforestation are embedded in international trade
In a study published in Global Environmental Change, Florence Pendrill and colleagues investigated where tropical deforestation was occurring; what products were driving this; and, using global trade models, they traced where these products were going in international supply chains. They found that tropical deforestation – given as the annual average between 2010 and 2014 – was responsible for 2.6 billion tonnes of CO2 per year. That was 6.5% of global CO2 emissions. International trade was responsible for around one-third (29%) of these emissions. This is probably less than many people would expect. Most emissions – 71% – came from foods consumed in the country that they were produced. It’s domestic demand, not international trade, that is the main driver of deforestation. In the chart we see how emissions from tropical deforestation are distributed through international supply chains. On the left-hand side we have the countries (grouped by region) where deforestation occurs, and on the right we have the countries and regions where these products are consumed. The paths between these end boxes indicate where emissions are being traded – the wider the bar, the more emissions are embedded in these products. Latin America exports around 23% of its emissions; that means more than three-quarters are generated for products that are consumed within domestic markets. The Asia-Pacific region – predominantly Indonesia and Malaysia – export a higher share: 44%. As we will see later, this is dominated by palm oil exports to Europe, China, India, North America and the Middle East. Deforestation in Africa is mainly driven by local populations and markets; only 9% of its emissions are exported. Since international demand is driving one-third of deforestation emissions, we have some opportunity to reduce emissions through global consumers and supply chains. But most emissions are driven by domestic markets – this means policies in the major producer countries will be key to tackling this problem. |
| 日期 | |
| 來源 | https://ourworldindata.org/deforestation |
| 作者 | Hannah Ritchie and Max Roser |
授權條款
[編輯]
- 您可以自由:
- 分享 – 複製、發佈和傳播本作品
- 重新修改 – 創作演繹作品
- 惟需遵照下列條件:
- 姓名標示 – 您必須指名出正確的製作者,和提供授權條款的連結,以及表示是否有對內容上做出變更。您可以用任何合理的方式來行動,但不得以任何方式表明授權條款是對您許可或是由您所使用。
- 相同方式分享 – 如果您利用本素材進行再混合、轉換或創作,您必須基於如同原先的相同或兼容的條款,來分布您的貢獻成品。
檔案歷史
點選日期/時間以檢視該時間的檔案版本。
| 日期/時間 | 縮圖 | 尺寸 | 用戶 | 備註 | |
|---|---|---|---|---|---|
| 目前 | 2021年12月14日 (二) 15:47 | | 1,493 × 1,714(207 KB) | PJ Geest(對話 | 貢獻) | Uploaded a work by Hannah Ritchie and Max Roser from https://ourworldindata.org/deforestation with UploadWizard |
無法覆蓋此檔案。
檔案用途
沒有使用此檔案的頁面。
全域檔案使用狀況
以下其他 wiki 使用了這個檔案:
- as.wikipedia.org 的使用狀況
- bn.wikipedia.org 的使用狀況
- cs.wikipedia.org 的使用狀況
- en.wikipedia.org 的使用狀況
- fa.wikipedia.org 的使用狀況
- ig.wikipedia.org 的使用狀況
- mk.wikipedia.org 的使用狀況
- zh.wikipedia.org 的使用狀況