File:Douglas 2020 precipitation layers.png
跳转到导航
跳转到搜索

本预览的尺寸:353 × 599像素。 其他分辨率:141 × 240像素 | 283 × 480像素 | 928 × 1,574像素。
原始文件 (928 × 1,574像素,文件大小:111 KB,MIME类型:image/png)
说明
说明
添加一行文字以描述该文件所表现的内容
摘要
[编辑]
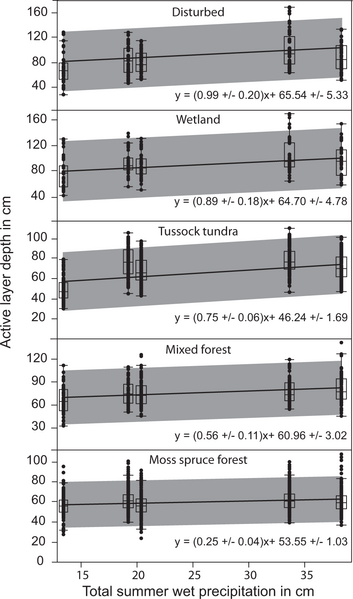
This graph from Douglas 2020 shows how increased w:precipitation increases the depth of w:permafrost active layer.
许可协议
[编辑]
文件历史
点击某个日期/时间查看对应时刻的文件。
| 日期/时间 | 缩略图 | 大小 | 用户 | 备注 | |
|---|---|---|---|---|---|
| 当前 | 2023年4月25日 (二) 16:11 | | 928 × 1,574(111 KB) | InformationToKnowledge(留言 | 贡献) | This graph from [https://www.nature.com/articles/s41612-020-0130-4 Douglas 2020] shows how increased precipitation increases the depth of permafrost active layer. |
您不可以覆盖此文件。
文件用途
没有页面使用本文件。
全域文件用途
以下其他wiki使用此文件:
- cs.wikipedia.org上的用途
- en.wikipedia.org上的用途
- zh.wikipedia.org上的用途