File:EPICA temperature plot.svg
跳转到导航
跳转到搜索

此SVG文件的PNG预览的大小:800 × 300像素。 其他分辨率:320 × 120像素 | 640 × 240像素 | 1,024 × 384像素 | 1,280 × 480像素 | 2,560 × 960像素 | 2,048 × 768像素。
原始文件 (SVG文件,尺寸为2,048 × 768像素,文件大小:96 KB)
说明
说明
添加一行文字以描述该文件所表现的内容
摘要
[编辑]
| 描述 |
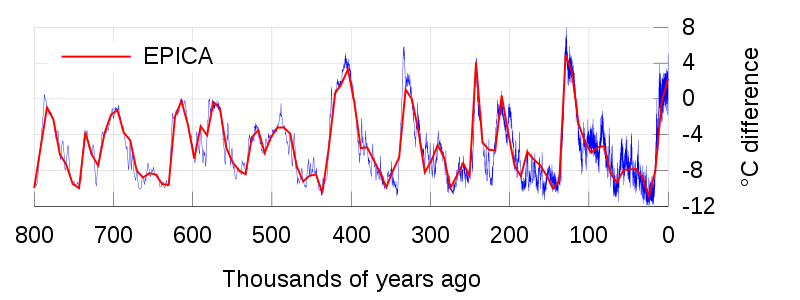
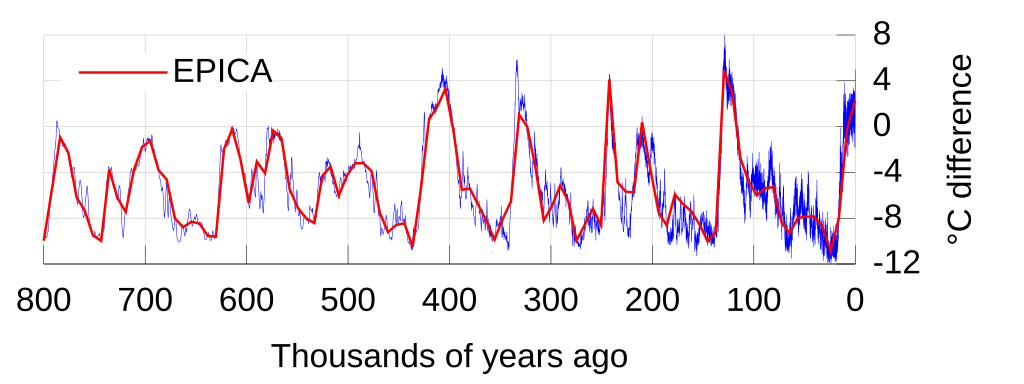
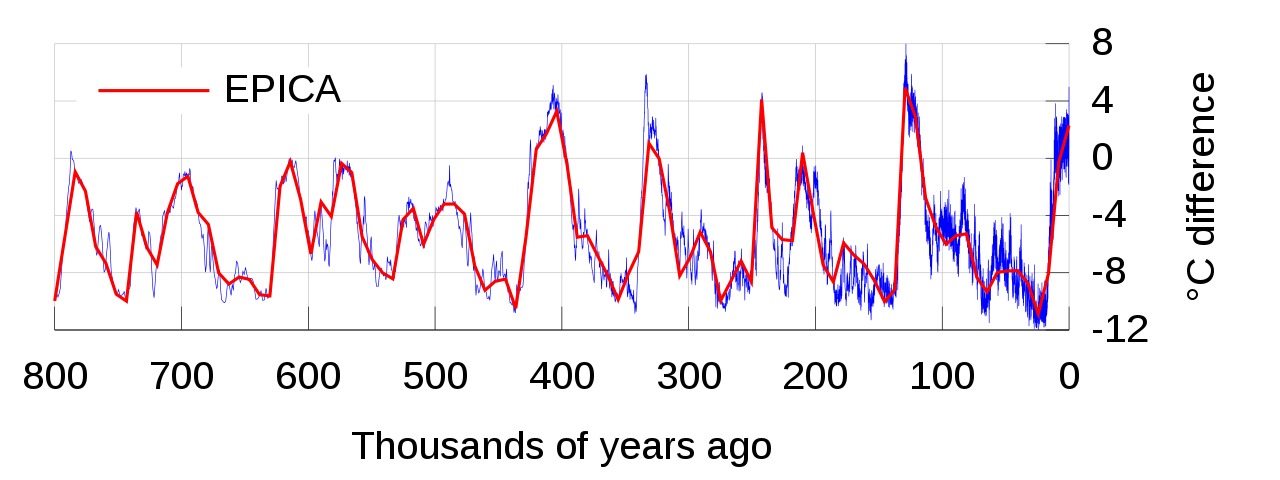
English: This figure shows the Antarctic temperature changes from EPICA during the last several glacial/interglacial cycles of the present ice age and a comparison to changes in global ice volume. The present day is on the right. |
| 日期 | |
| 来源 | 自己的作品 |
| 作者 | Autopilot |
| SVG开发 | |
| 源代码 | Gnuplot codeset term svg size 2048,768 fsize 50
set output "epica-temp.svg"
set border 1
set xtics nomirror
set ytics nomirror
set grid y2 lc rgb "#C0C0C0"
set grid x lc rgb "#C0C0C0"
set xlabel "Thousands of years ago"
set y2label "°C difference"
set y2tics 4
unset ytics
set key reverse top left
plot [800:0] \
"edc3deuttemp2007.txt" \
using ($3/1000):5 \
notitle \
lc rgb "blue" \
with lines, \
"" \
using ($3/1000):5 \
title "EPICA" \
smooth csplines \
lw 5 \
lc rgb "red" \
with lines \
|
许可协议
[编辑]
我,本作品著作权人,特此采用以下许可协议发表本作品:
本文件采用知识共享署名-相同方式共享 3.0 未本地化版本许可协议授权。
- 您可以自由地:
- 共享 – 复制、发行并传播本作品
- 修改 – 改编作品
- 惟须遵守下列条件:
- 署名 – 您必须对作品进行署名,提供授权条款的链接,并说明是否对原始内容进行了更改。您可以用任何合理的方式来署名,但不得以任何方式表明许可人认可您或您的使用。
- 相同方式共享 – 如果您再混合、转换或者基于本作品进行创作,您必须以与原先许可协议相同或相兼容的许可协议分发您贡献的作品。

|
已授权您依据自由软件基金会发行的无固定段落及封面封底文字(Invariant Sections, Front-Cover Texts, and Back-Cover Texts)的GNU自由文件许可协议1.2版或任意后续版本的条款,复制、传播和/或修改本文件。该协议的副本请见“GNU Free Documentation License”。 |
您可以选择您需要的许可协议。
文件历史
点击某个日期/时间查看对应时刻的文件。
| 日期/时间 | 缩略图 | 大小 | 用户 | 备注 | |
|---|---|---|---|---|---|
| 当前 | 2021年6月25日 (五) 12:30 | 2,048 × 768(96 KB) | Matěj Orlický(留言 | 贡献) | cs translation | |
| 2015年2月20日 (五) 21:39 | 2,048 × 768(96 KB) | Delphi234(留言 | 贡献) | add translations | ||
| 2010年7月13日 (二) 01:48 | 2,048 × 768(93 KB) | Autopilot(留言 | 贡献) | {{Information |Description={{en|1=This figure shows the {{W|Antarctica|Antarctic}} {{w|temperature}} changes during the last several glacial/interglacial cycles of the present {{w|ice age}} and a comparison to changes in global ice volume. The present da |
您不可以覆盖此文件。
文件用途
没有页面使用本文件。
全域文件用途
以下其他wiki使用此文件:
- cs.wikipedia.org上的用途
- en.wikipedia.org上的用途
- fr.wikipedia.org上的用途
- hu.wikipedia.org上的用途
- ko.wikipedia.org上的用途
- zh.wikipedia.org上的用途