File:Eastern Cape 2001 dominant language map.svg
ナビゲーションに移動
検索に移動

この SVG ファイルのこの PNG プレビューのサイズ: 800 × 526 ピクセル. その他の解像度: 320 × 210 ピクセル | 640 × 421 ピクセル | 1,024 × 674 ピクセル | 1,280 × 842 ピクセル | 2,560 × 1,684 ピクセル | 1,233 × 811 ピクセル。
元のファイル (SVG ファイル、1,233 × 811 ピクセル、ファイルサイズ: 1.5メガバイト)
キャプション
キャプション
このファイルの内容を1行で記述してください
概要[編集]
| 解説 |
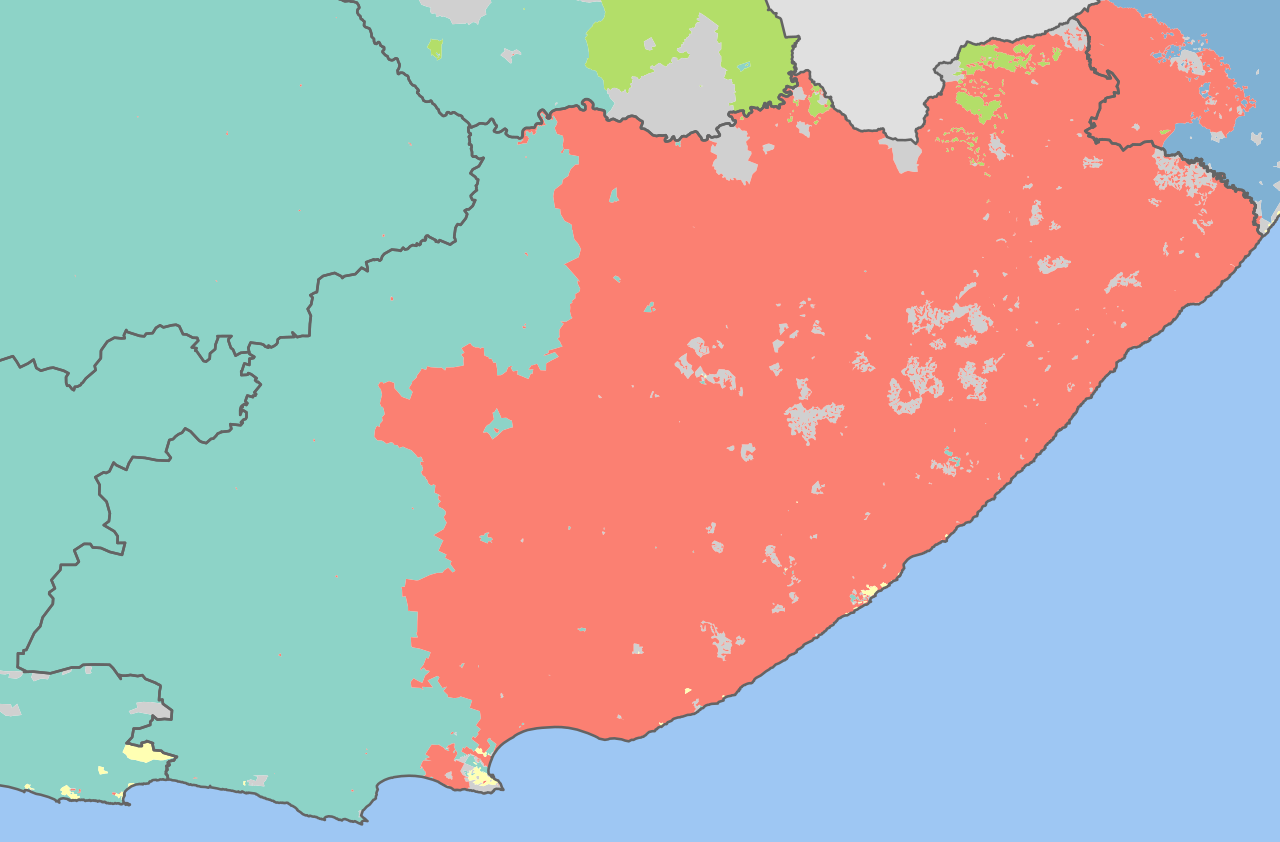
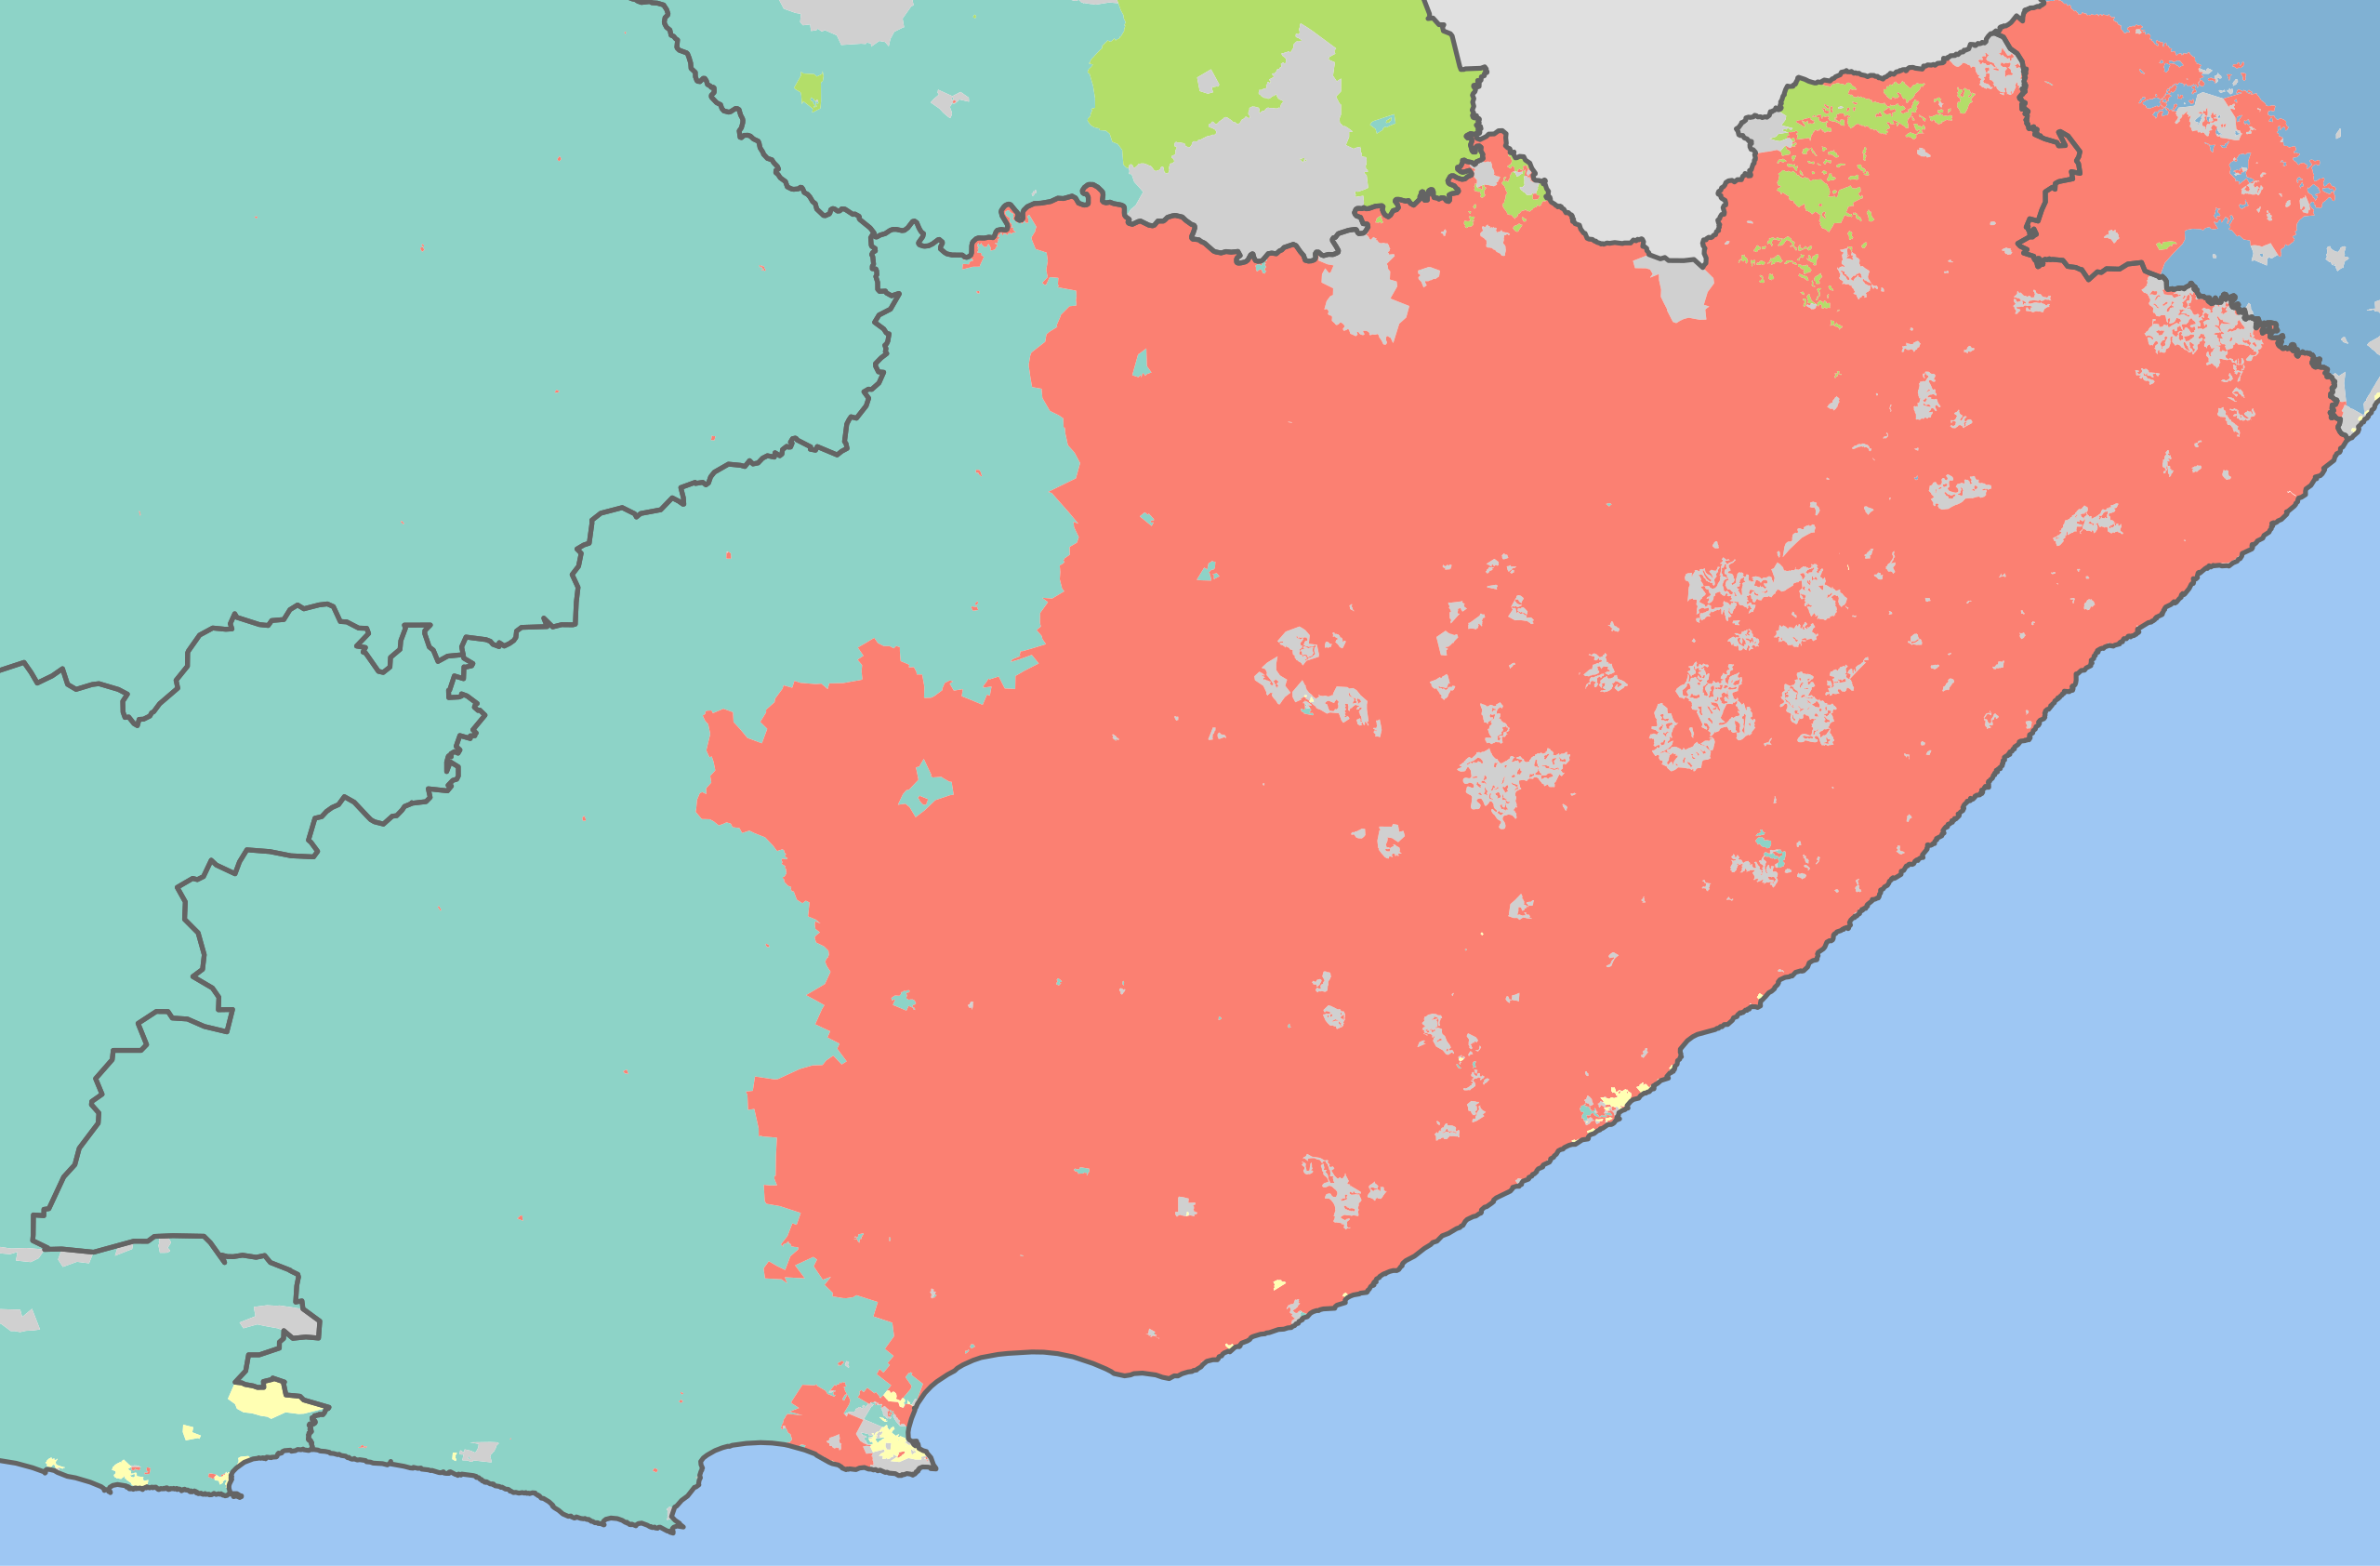
English: Map showing the dominant home languages in the Eastern Cape province of South Africa, according to Census 2001 at the "Subplace" level. In this context, a language is dominant if it more than 50% of the population in an area speak it at home, or more than 33% speak it and no other language is spoken by more than 25%.
Afrikaans
English
isiXhosa
isiZulu
Sesotho
No language dominant |
| 日付 | |
| 原典 | Statistics South Africa's Census 2001 is the source of the basic population data. The map results from my own processing of the data. |
| 作者 | Htonl |
ライセンス[編集]
The following license applies to the population data on which the map is based:

|
このファイルの著作権者Stats SAは、あらゆる人があらゆる目的でこのファイルを使用することを許可しています。ただし著作権者の名義が適切に表示されることを条件とします。再頒布、二次的著作物の製作、商用利用等のあらゆる使用が許可されています。 |
帰属:
"the user acknowledges Stats SA as the source of the basic data wherever they process, apply, utilise, publish or distribute the data, and also that they specify that the relevant application and analysis (where applicable) result from their own processing of the data" [1]
|
The following tag applies to the map itself:
| この著作物の著作権者である私は、この著作物における権利を放棄しパブリックドメインとします。これは全世界で適用されます。 一部の国では、これが法的に可能ではない場合があります。その場合は、次のように宣言します。 私は、あらゆる人に対して、法により必要とされている条件を除き、如何なる条件も課すことなく、あらゆる目的のためにこの著作物を使用する権利を与えます。 |
ファイルの履歴
過去の版のファイルを表示するには、その版の日時をクリックしてください。
| 日付と時刻 | サムネイル | 寸法 | 利用者 | コメント | |
|---|---|---|---|---|---|
| 現在の版 | 2010年10月5日 (火) 05:47 | | 1,233 × 811 (1.5メガバイト) | Htonl (トーク | 投稿記録) | equal-area projection, map styling |
| 2010年2月16日 (火) 11:09 |  | 1,151 × 683 (4.89メガバイト) | Htonl (トーク | 投稿記録) | size | |
| 2010年2月15日 (月) 19:30 |  | 1,000 × 594 (4.68メガバイト) | Htonl (トーク | 投稿記録) | fix errors | |
| 2010年2月10日 (水) 21:39 |  | 1,000 × 594 (4.93メガバイト) | Htonl (トーク | 投稿記録) | =={{int:filedesc}}== {{Information |Description={{en|1=Map showing the dominant home languages in the Eastern Cape province of South Africa, according to Census 2001 at the "Subplace" level. In this context, a language is dominant if it more than 50% of t |
このファイルは上書きできません。
ファイルの使用状況
以下の 3 ページがこのファイルを使用しています:
グローバルなファイル使用状況
以下に挙げる他のウィキがこの画像を使っています:
- af.wikipedia.org での使用状況
- de.wikipedia.org での使用状況
- en.wikipedia.org での使用状況
- frr.wikipedia.org での使用状況
- he.wikipedia.org での使用状況
- hy.wikipedia.org での使用状況
- incubator.wikimedia.org での使用状況
- ja.wikipedia.org での使用状況
- ka.wikipedia.org での使用状況
- ko.wikipedia.org での使用状況
- ru.wikipedia.org での使用状況
- zu.wikipedia.org での使用状況