File:Estimations of Human Brain Emulation Required Performance.svg
跳转到导航
跳转到搜索

此SVG文件的PNG预览的大小:800 × 600像素。 其他分辨率:320 × 240像素 | 640 × 480像素 | 1,024 × 768像素 | 1,280 × 960像素 | 2,560 × 1,920像素。
原始文件 (SVG文件,尺寸为800 × 600像素,文件大小:49 KB)
说明
说明
添加一行文字以描述该文件所表现的内容
摘要
[编辑]
| 描述 |
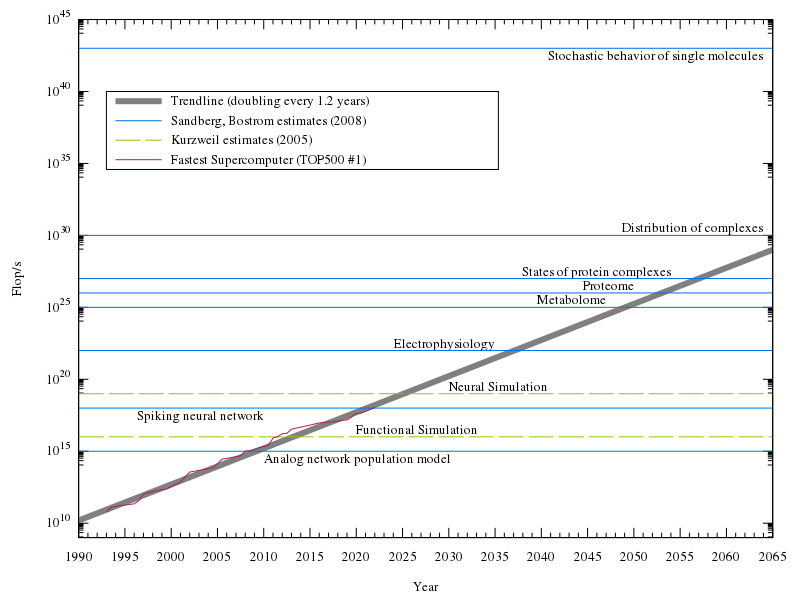
English: Estimates of how much processing power is needed to emulate a human brain at various levels, along with the fastest supercomputer from TOP500 mapped by year, and a trendline. Exponential plot, with assumption of doubling of computational power every 1.1 years for the trendline. |
| 日期 | |
| 来源 | 自己的作品, data from [1], PPTSuperComputersPRINT.jpg, and [2]. |
| 作者 | Tga.D |
| SVG开发 | |
| 源代码 | Gnuplot codeset terminal svg size 800 600 fname "Times,13"
set output "Estimations of Human Brain Emulation Required Performance.svg"
set notitle
set key reverse Left left at 1993, 10**40 noautotitles box # good chunk of whitespace to put the key in
set datafile separator ","
set logscale y # use a logarithmic scale, for easier visualization of exponential growth
set format y "10^{%T}"
set yrange[10**9:10**45]
set ylabel "Flop/s"
set xrange [1990:2065]
set xlabel "Year"
set xtics 1990,5,2065
set mxtics 5
#set grid # I think it looks better without, but it's a matter of preference
# labels for each of the levels of emulation
set label "Analog network population model" at 2010, 10**14.5 left
set label "Spiking neural network" at 2010, 10**17.5 right
set label "Electrophysiology" at 2035, 10**22.5 right
set label "Metabolome" at 2047, 10**25.5 right
set label "Proteome" at 2050, 10**26.5 right
set label "States of protein complexes" at 2054, 10**27.5 right
set label "Distribution of complexes" at 2064, 10**30.5 right
set label "Stochastic behavior of single molecules" at 2064, 10**42.5 right
set label "Functional Simulation" at 2020, 10**16.5 left
set label "Neural Simulation" at 2030, 10**19.5 left
# best-fit is as of June 2022 list, to two sigfigs
# horizontal lines plotted to represent levels of emulation
# plot of historical TOP500 #1's stored in a .csv
# colors and sizes picked from what I thought was easiest to see
# titles done for one of each type of line, for the key
plot 87000000000.0*(2**((x-1993)/1.2)) lw 6 lc 0 w lines title "Trendline (doubling every 1.2 years)",\
10**15 ls 3 lt rgb "#0073E6", \
10**18 ls 3 lt rgb "#0073E6", \
10**22 ls 3 lt rgb "#0073E6", \
10**25 ls 3 lt rgb "#0073E6", \
10**26 ls 3 lt rgb "#0073E6", \
10**27 ls 3 lt rgb "#0073E6", \
10**30 ls 3 lt rgb "#0073E6", \
10**43 ls 3 lt rgb "#0073E6" title "Sandberg, Bostrom estimates (2008)",\
10**16 ls 2 dt (50,10) lc rgb "#89CE00", \
10**19 ls 2 dt (50,10) lt rgb "#89CE00" title "Kurzweil estimates (2005)",\
"TOP500.csv" using 1:2 ls 1 lt rgb "#B51963" pt 7 ps .5 with linespoints title "Fastest Supercomputer (TOP500 #1)"
DataThe #1 computer over the years from TOP500, used to generate the supercomputer line at the end of the Gnuplot code. The name of each supercomputer is in the file, but unused in the code/chart. Whole number years represent a June list, .5 represents a November list.
Year,Flop/s,Name
1993,59700000000,CM-5/1024
1993.5,124000000000,Numerical Wind Tunnel
1994,143400000000,XP/S140
1994.5,170000000000,Numerical Wind Tunnel
1996,220400000000,SR2201/1024
1996.5,368200000000,CP-PACS/2048
1997,1068000000000,ASCI Red
1997.5,1338000000000,ASCI Red
1999,2121000000000,ASCI Red
1999.5,2379000000000,ASCI Red
2000.5,4938000000000,ASCI White
2001,7226000000000,ASCI White
2002,35860000000000,Earth-Simulator
2004.5,70720000000000,BlueGene/L beta-System
2005,136800000000000,BlueGene/L
2005.5,280600000000000,BlueGene/L
2007.5,478200000000000,BlueGene/L
2008,1026000000000000,Roadrunner
2008.5,1105000000000000,Roadrunner
2009.5,1759000000000000,Jaguar
2010.5,2566000000000000,Tianhe-1A
2011,8162000000000000,K computer
2011.5,10510000000000000,K computer
2012,16324800000000000,Sequoia
2012.5,17590000000000000,Titan
2013,33862700000000000,Tianhe-2A
2016,93014600000000000,Sunway TaihuLight
2018,122300000000000000,Summit
2018.5,143500000000000000,Summit
2020,415530000000000000,Fugaku
2020.5,442000000000000000,Fugaku
2022,1102000000000000000,Frontier
|
许可协议
[编辑]
我,本作品著作权人,特此采用以下许可协议发表本作品:
本文件采用知识共享署名-相同方式共享 3.0 未本地化版本许可协议授权。
- 您可以自由地:
- 共享 – 复制、发行并传播本作品
- 修改 – 改编作品
- 惟须遵守下列条件:
- 署名 – 您必须对作品进行署名,提供授权条款的链接,并说明是否对原始内容进行了更改。您可以用任何合理的方式来署名,但不得以任何方式表明许可人认可您或您的使用。
- 相同方式共享 – 如果您再混合、转换或者基于本作品进行创作,您必须以与原先许可协议相同或相兼容的许可协议分发您贡献的作品。
文件历史
点击某个日期/时间查看对应时刻的文件。
| 日期/时间 | 缩略图 | 大小 | 用户 | 备注 | |
|---|---|---|---|---|---|
| 当前 | 2023年2月22日 (三) 00:40 | | 800 × 600(49 KB) | Tga.D(留言 | 贡献) | updated data, fixed colors and styles to be more color blind-friendly |
| 2022年3月7日 (一) 16:11 |  | 800 × 600(37 KB) | Daemon2010(留言 | 贡献) | Added Fugaku | |
| 2019年2月20日 (三) 06:32 |  | 800 × 600(45 KB) | Tga.D(留言 | 贡献) | Increase font size; adjust label positions | |
| 2019年2月20日 (三) 06:15 |  | 800 × 600(45 KB) | Tga.D(留言 | 贡献) | Regenerated with a newer version of gnuplot, and more recent TOP500 data. Opted to not update the trendline, as the divergence from expected seems more relevant. | |
| 2013年6月18日 (二) 22:20 |  | 800 × 600(34 KB) | Tga.D(留言 | 贡献) | New #1 on the TOP 500 June 2013 list. | |
| 2012年12月24日 (一) 01:07 |  | 800 × 600(34 KB) | Tga.D(留言 | 贡献) | large mediawiki-generated png versions had messed up spacing in the key, switching the order to see if it fixes it | |
| 2012年12月24日 (一) 00:29 |  | 800 × 600(34 KB) | Tga.D(留言 | 贡献) | User created page with UploadWizard |
您不可以覆盖此文件。
文件用途
没有页面使用本文件。
全域文件用途
以下其他wiki使用此文件:
- ar.wikipedia.org上的用途
- bs.wikipedia.org上的用途
- ca.wikipedia.org上的用途
- en.wikipedia.org上的用途
- es.wikipedia.org上的用途
- fa.wikipedia.org上的用途
- fr.wikipedia.org上的用途
- gl.wikipedia.org上的用途
- he.wikipedia.org上的用途
- hu.wikipedia.org上的用途
- id.wikipedia.org上的用途
- ja.wikipedia.org上的用途
- ru.wikipedia.org上的用途
- th.wikipedia.org上的用途
- uk.wikipedia.org上的用途
- zh.wikipedia.org上的用途