File:Eu-estimation-tolerance-absolute.svg
ナビゲーションに移動
検索に移動

この SVG ファイルのこの PNG プレビューのサイズ: 300 × 300 ピクセル. その他の解像度: 240 × 240 ピクセル | 480 × 480 ピクセル | 768 × 768 ピクセル | 1,024 × 1,024 ピクセル | 2,048 × 2,048 ピクセル。
元のファイル (SVG ファイル、300 × 300 ピクセル、ファイルサイズ: 10キロバイト)
キャプション
キャプション
このファイルの内容を1行で記述してください
概要
[編集]
| 解説 | |
| 日付 | |
| 原典 |
Self-made in gnuplot. |
| 作者 | Nils R. Barth |
| その他のバージョン | File:Eu-estimation-tolerance-relative.svg (relative tolerances) |
gnuplot source
[編集]
# Graphs of errors for the EU “estimated sign”
# Set terminal
set terminal svg enhanced size 300 300 fs 10
set samples 1001 # high quality
set border 31 linewidth .3 # thin border
unset key # no key
# Tolerable error function:
# input is nominal quantity
# output is tolerable negative error, as an absolute quantity
#
# e(x)/x is thus tolerable ~relative~ error
#
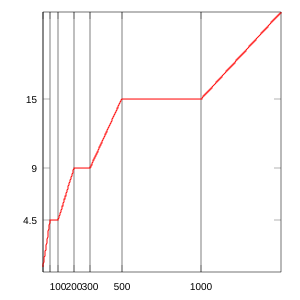
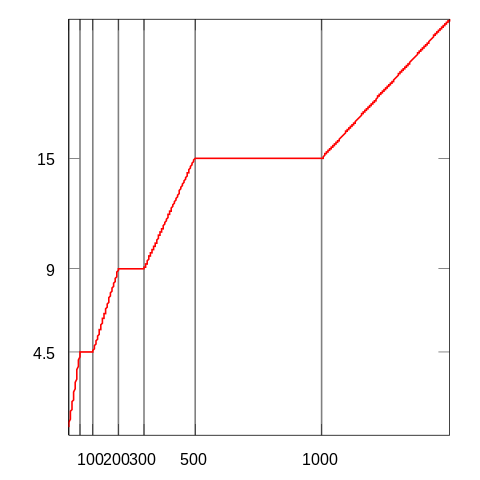
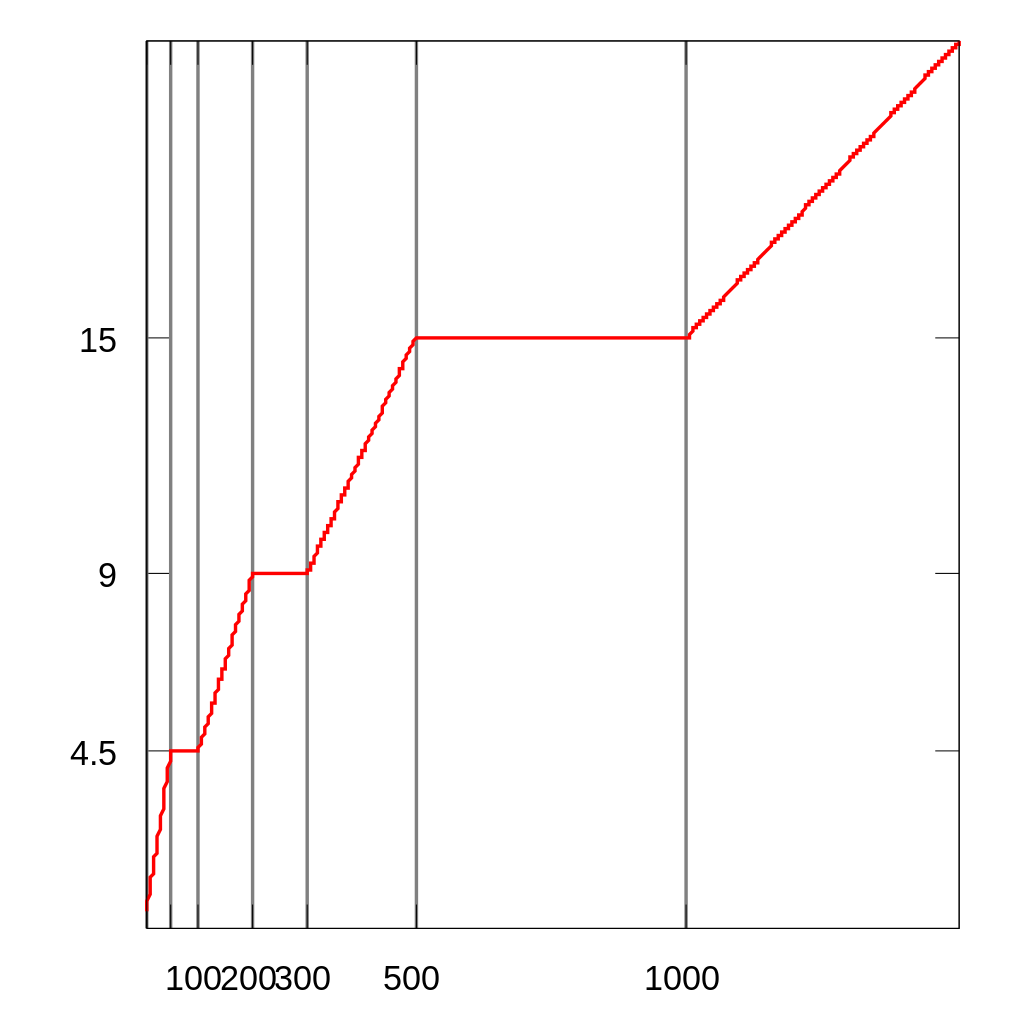
e(x) = x < 50 ? 9e-2 * x \
: x < 100 ? 4.5 \
: x < 200 ? 4.5e-2 * x \
: x < 300 ? 9 \
: x < 500 ? 3e-2 * x \
: x < 1000 ? 15 \
: 1.5e-2 * x
# X-range and x-tics
# Set x tics at the cutoff points
set xtics ("" 5, "" 50, "100" 100, "200" 200, "300" 300, "500" 500, "1000" 1000)
# Set representative x-range:
# undefined below 5, and
# extending above 1500 to 10,000 just shrinks the interesting part of the graph
#
# (A log-scale on the x-axis would fit everything in, but obscure the linearity
# in the absolute error; it would be ok in the relative error though.)
set xrange [5:1500]
# Draw the x grid, to show ranges
set grid x
####################
# Absolute error
####################
# Set y tics at the fixed amounts
set ytics (4.5,9,15)
# Set y-range to go from 0 to max (over this x-range)
set yrange [0:22.5]
set output "eu-estimation-tolerance-absolute.svg"
plot e(x)
####################
# Relative error
####################
# Set y-tics at the fixed percentages
set ytics (1.5, 3, 4.5, 9)
# Set y-range (0% – 10%) to include all percentages, with clearance for 9%.
set yrange [0:10]
set format y "%g %%" # Format as percentage
set output "eu-estimation-tolerance-relative.svg"
# Multiply by 100 so as a percentage
plot e(x)/x*100
ライセンス
[編集]
この作品の著作権者であるNils R. Barthは、この作品を以下のライセンスで提供しています。
| この著作物の著作権者である私は、この著作物における権利を放棄しパブリックドメインとします。これは全世界で適用されます。 一部の国では、これが法的に可能ではない場合があります。その場合は、次のように宣言します。 私は、あらゆる人に対して、法により必要とされている条件を除き、如何なる条件も課すことなく、あらゆる目的のためにこの著作物を使用する権利を与えます。 |
ファイルの履歴
過去の版のファイルを表示するには、その版の日時をクリックしてください。
| 日付と時刻 | サムネイル | 寸法 | 利用者 | コメント | |
|---|---|---|---|---|---|
| 現在の版 | 2009年3月25日 (水) 03:24 | | 300 × 300 (10キロバイト) | Nbarth (トーク | 投稿記録) | Thinner border. |
| 2009年3月25日 (水) 03:09 |  | 300 × 300 (8キロバイト) | Nbarth (トーク | 投稿記録) | Fix nominal size so agrees with target size (300, not 1000). | |
| 2009年3月25日 (水) 02:56 |  | 1,000 × 1,000 (13キロバイト) | Nbarth (トーク | 投稿記録) | Smaller text to avoid collision | |
| 2009年3月25日 (水) 02:54 |  | 1,000 × 1,000 (13キロバイト) | Nbarth (トーク | 投稿記録) | Thicker lines, bigger text | |
| 2009年3月25日 (水) 02:01 |  | 1,000 × 1,000 (14キロバイト) | Nbarth (トーク | 投稿記録) | {{Information |Description={{en|1=Absolute estimation tolerances for the European Union estimated sign.}} |Source=Own work by uploader |Author=Nbarth |Date=2009-03-25 |Permission= |other_versio |
このファイルは上書きできません。
ファイルの使用状況
このファイルを使用しているページはありません。
グローバルなファイル使用状況
以下に挙げる他のウィキがこの画像を使っています:
- ca.wikipedia.org での使用状況
- en.wikipedia.org での使用状況
- es.wikipedia.org での使用状況
- fa.wikipedia.org での使用状況
- ja.wikipedia.org での使用状況