File:Eu-estimation-tolerance-relative.svg
Ir a la navegación
Ir a la búsqueda

Tamaño de esta previsualización PNG del archivo SVG: 300 × 300 píxeles. Otras resoluciones: 240 × 240 píxeles | 480 × 480 píxeles | 768 × 768 píxeles | 1024 × 1024 píxeles | 2048 × 2048 píxeles.
Archivo original (archivo SVG, nominalmente 300 × 300 píxeles, tamaño de archivo: 9 kB)
Leyendas
Leyendas
Añade una explicación corta acerca de lo que representa este archivo
Resumen[editar]
| Descripción | |
| Fecha | |
| Fuente |
Self-made in gnuplot. |
| Autor | Nils R. Barth |
| Otras versiones | File:Eu-estimation-tolerance-absolute.svg (absolute tolerances) |
gnuplot source[editar]
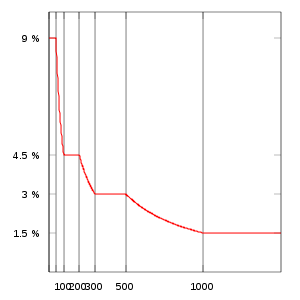
# Graphs of errors for the EU “estimated sign”

# Set terminal
set terminal svg enhanced size 300 300 fs 10
set samples 1001  # high quality
set border 31 linewidth .3 # thin border
unset key # no key

# Tolerable error function:
#  input is nominal quantity
#  output is tolerable negative error, as an absolute quantity
#
# e(x)/x is thus tolerable ~relative~ error
#
e(x) = x <   50 ?   9e-2 * x  \
     : x <  100 ?        4.5  \
     : x <  200 ? 4.5e-2 * x  \
     : x <  300 ?        9    \
     : x <  500 ?   3e-2 * x  \
     : x < 1000 ?       15    \
     :            1.5e-2 * x

# X-range and x-tics

# Set x tics at the cutoff points
set xtics ("" 5, "" 50, "100" 100, "200" 200, "300" 300, "500" 500, "1000" 1000)

# Set representative x-range:
#  undefined below 5, and
#  extending above 1500 to 10,000 just shrinks the interesting part of the graph
#
# (A log-scale on the x-axis would fit everything in, but obscure the linearity
#  in the absolute error; it would be ok in the relative error though.)
set xrange [5:1500]

# Draw the x grid, to show ranges
set grid x

####################
# Absolute error
####################

# Set y tics at the fixed amounts
set ytics (4.5,9,15)

# Set y-range to go from 0 to max (over this x-range)
set yrange [0:22.5]

set output "eu-estimation-tolerance-absolute.svg"
plot e(x)

####################
# Relative error
####################

# Set y-tics at the fixed percentages
set ytics (1.5, 3, 4.5, 9)

# Set y-range (0% – 10%) to include all percentages, with clearance for 9%.
set yrange [0:10]
set format y "%g %%" # Format as percentage

set output "eu-estimation-tolerance-relative.svg"
# Multiply by 100 so as a percentage
plot e(x)/x*100
Licencia[editar]
Nils R. Barth, titular de los derechos de autor de esta obra, la publica en los términos de la siguiente licencia:
| Yo, el titular de los derechos de autor de esta obra, lo libero al dominio público. Esto aplica en todo el mundo. En algunos países esto puede no ser legalmente factible; si ello ocurriese: Concedo a cualquier persona el derecho de usar este trabajo para cualquier propósito, sin ningún tipo de condición al menos que éstas sean requeridas por la ley. |
Historial del archivo
Haz clic sobre una fecha y hora para ver el archivo tal como apareció en ese momento.
| Fecha y hora | Miniatura | Dimensiones | Usuario | Comentario | |
|---|---|---|---|---|---|
| actual | 03:25 25 mar 2009 | | 300 × 300 (9 kB) | Nbarth (discusión | contribs.) | Thinner border. |
| 02:57 25 mar 2009 |  | 1000 × 1000 (13 kB) | Nbarth (discusión | contribs.) | Thicker lines, bigger text | |
| 02:23 25 mar 2009 |  | 1000 × 1000 (13 kB) | Nbarth (discusión | contribs.) | {{Information |Description={{en|1=Relative estimation tolerances for the European Union estimated sign.}} |Source=Own work by uploader |Author=Nbarth |Date=2009-03-25 |Permission= |other_versio |
No puedes sobrescribir este archivo.
Usos del archivo
No hay páginas que enlacen a este archivo.
Uso global del archivo
Las wikis siguientes utilizan este archivo:
- Uso en ca.wikipedia.org
- Uso en en.wikipedia.org
- Uso en es.wikipedia.org
- Uso en fa.wikipedia.org
- Uso en ja.wikipedia.org