File:GISS temperature 2000-09 lrg.png
Aller à la navigation
Aller à la recherche

Taille de cet aperçu : 800 × 400 pixels. Autres résolutions : 320 × 160 pixels | 640 × 320 pixels | 1 024 × 512 pixels | 1 280 × 640 pixels | 2 880 × 1 440 pixels.
Fichier d’origine (2 880 × 1 440 pixels, taille du fichier : 545 kio, type MIME : image/png)
Légendes
Légendes
Ajoutez en une ligne la description de ce que représente ce fichier
Description[modifier]
| Description |
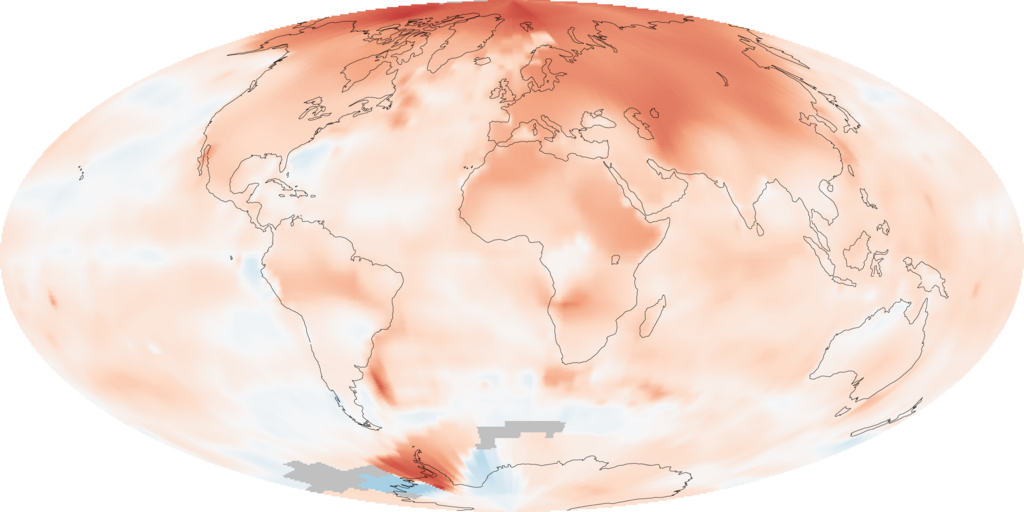
English: The map illustrates just how much warmer temperatures were in the decade (2000-2009) compared to average temperatures recorded between 1951 and 1980 (a common reference period for climate studies). The most extreme warming, shown in red, was in the Arctic. Very few areas saw cooler than average temperatures, shown in blue. Gray areas over parts of the Southern Ocean are places where temperatures were not recorded. The analysis, conducted by the Goddard Institute for Space Studies (GISS) in New York City, is based on temperatures recorded at meteorological (weather) stations around the world and satellite data over the oceans.
|
| Date | |
| Source | NASA Earth Observatory Image of the Day: 2009 Ends Warmest Decade on Record http://earthobservatory.nasa.gov/IOTD/view.php?id=42392 |
| Auteur | NASA images by Robert Simmon, based on data from the Goddard Institute for Space Studies. |
Conditions d’utilisation[modifier]
| Ce fichier provient de la NASA. Sauf exception, les documents créés par la NASA ne sont pas soumis à copyright. Pour plus d'informations, voir la politique de copyright de la NASA. | ||
 |
Attention :
|
Historique du fichier
Cliquer sur une date et heure pour voir le fichier tel qu'il était à ce moment-là.
| Date et heure | Vignette | Dimensions | Utilisateur | Commentaire | |
|---|---|---|---|---|---|
| actuel | 23 janvier 2010 à 03:09 | | 2 880 × 1 440 (545 kio) | Petersam (d | contributions) | {{Information |Description={{en|1=The map illustrate just how much warmer temperatures were in the decade (2000-2009) compared to average temperatures recorded between 1951 and 1980 (a common reference period for climate studies). The most extreme warming |
Vous ne pouvez pas remplacer ce fichier.
Utilisations locales du fichier
Aucune page n’utilise ce fichier.
Utilisations du fichier sur d’autres wikis
Les autres wikis suivants utilisent ce fichier :
- Utilisation sur ar.wikipedia.org
- Utilisation sur as.wikipedia.org
- Utilisation sur bn.wikipedia.org
- Utilisation sur bxr.wikipedia.org
- Utilisation sur cs.wikipedia.org
- Utilisation sur en.wikipedia.org
- Utilisation sur en.wikiversity.org
- Utilisation sur es.wikipedia.org
- Utilisation sur fa.wikipedia.org
- Utilisation sur fr.wikipedia.org
- Utilisation sur id.wikipedia.org
- Utilisation sur ilo.wikipedia.org
- Utilisation sur it.wikipedia.org
- Utilisation sur ko.wikipedia.org
- Utilisation sur or.wikipedia.org
- Utilisation sur pnb.wikipedia.org
- Utilisation sur pt.wikipedia.org
- Utilisation sur pt.wikinews.org
- Utilisation sur si.wikipedia.org
- Utilisation sur sv.wikipedia.org
- Utilisation sur uk.wikipedia.org
- Utilisation sur vi.wikipedia.org
- Utilisation sur www.wikidata.org
- Utilisation sur zh.wikipedia.org