File:Greenhouse Effect.svg

原始文件 (SVG文件,尺寸为750 × 577像素,文件大小:21 KB)
说明
说明
摘要
[编辑]| 描述 |
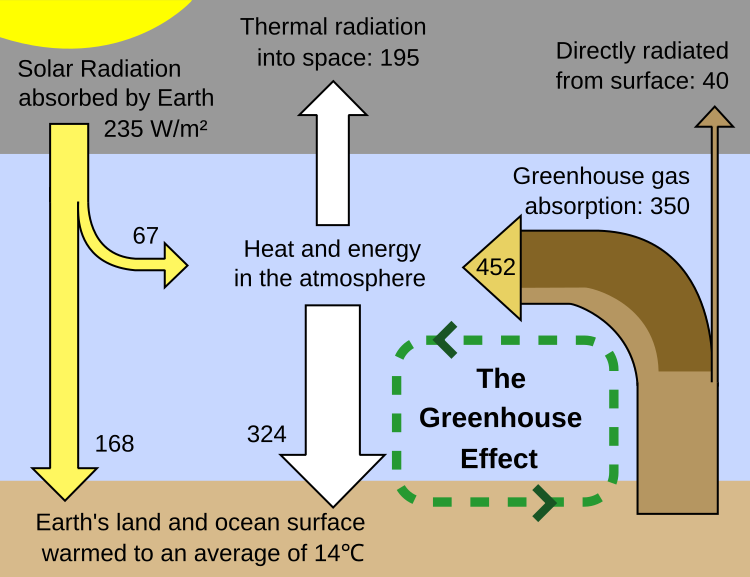
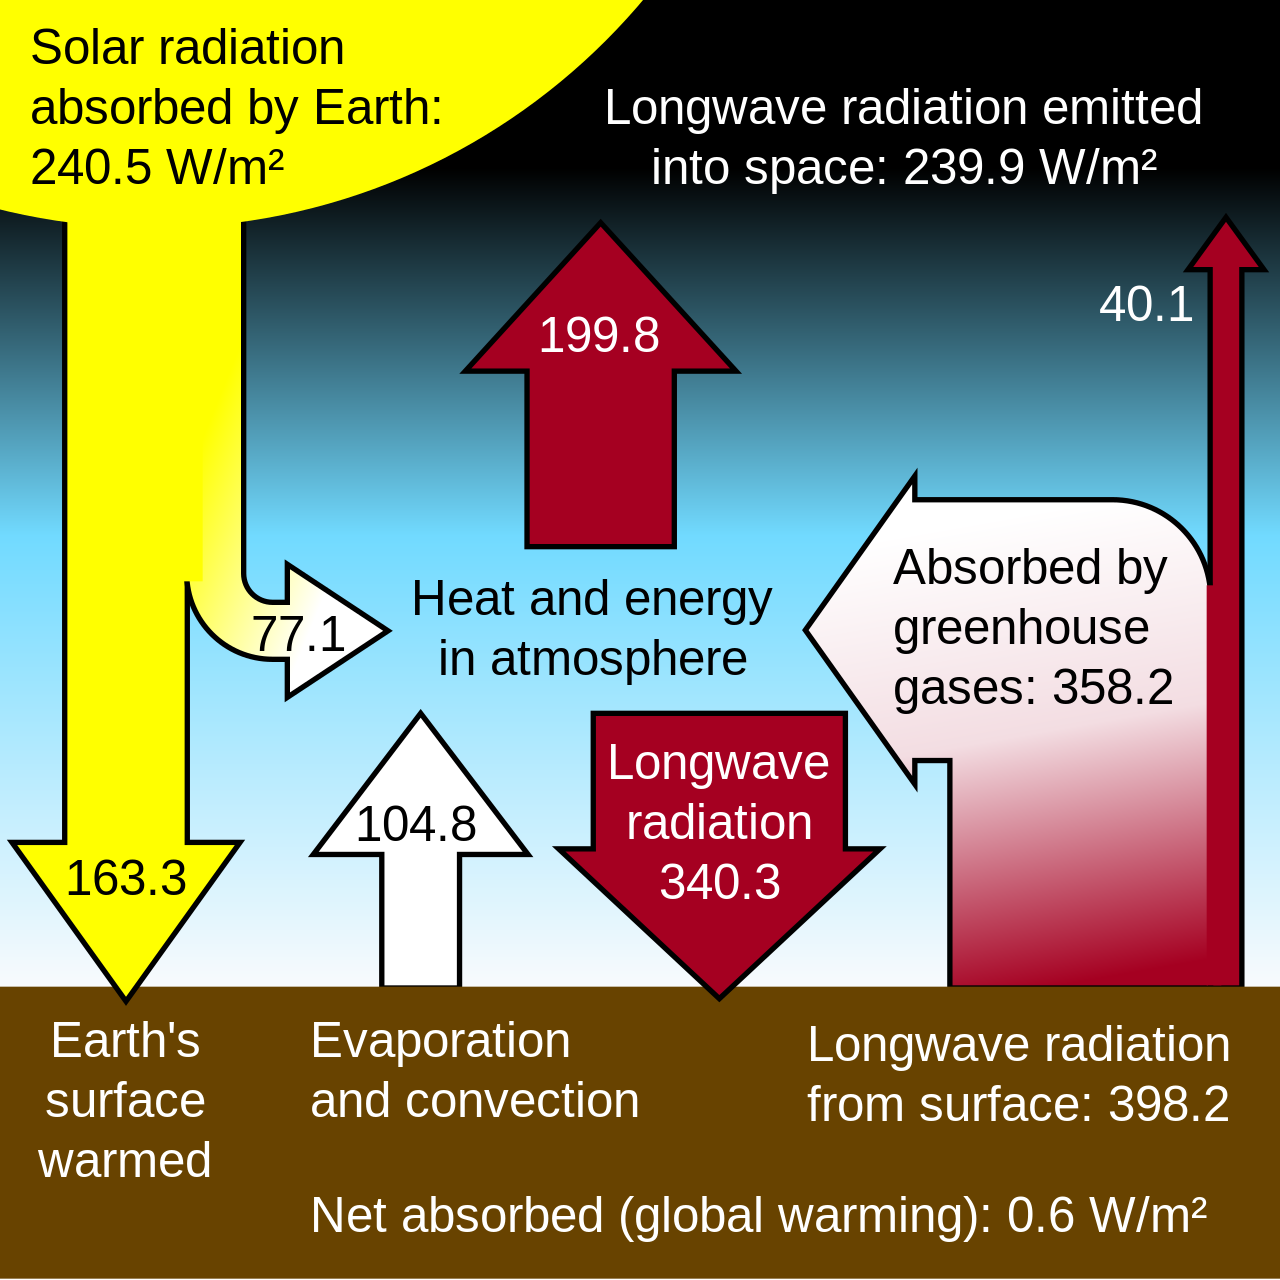
English: This figure is a simplified, schematic representation of the flows of energy between space, the atmosphere, and the Earth's surface, and shows how these flows combine to trap heat near the surface and create the greenhouse effect. Energy exchanges are expressed in watts per square meter (W/m2) and derived from Kiehl & Trenberth (1997). Complete figure: (http://www.cgd.ucar.edu/cas/abstracts/files/kevin1997_1.html UCAR.edu) Suggested corrections:
The sun is responsible for virtually all energy that reaches the Earth's surface. Direct overhead sunlight at the top of the atmosphere provides 1366 W/m2; however, geometric effects and reflective surfaces limit the light which is absorbed at the typical location to an annual average of ~235 W/m2. If this were the total heat received at the surface, then, neglecting changes in albedo, the Earth's surface would be expected to have an average temperature of -18 °C (Lashof 1989). Of the surface heat captured by the atmosphere, more than 75% can be attributed to the action of greenhouse gases that absorb thermal radiation emitted by the Earth's surface. The atmosphere in turn transfers the energy it receives both into space (38%) and back to the Earth's surface (62%), where the amount transferred in each direction depends on the thermal and density structure of the atmosphere. This process by which energy is recycled in the atmosphere to warm the Earth's surface is known as the greenhouse effect and is an essential piece of Earth's climate. Under stable conditions, the total amount of energy entering the system from solar radiation will exactly balance the amount being radiated into space, thus allowing the Earth to maintain a constant average temperature over time. |
| 来源 |
|
| 作者 | Robert A. Rohde (英语维基百科的Dragons flight) |
| 其他版本 |
[]
|
| SVG开发 |


许可协议
[编辑]

|
已授权您依据自由软件基金会发行的无固定段落及封面封底文字(Invariant Sections, Front-Cover Texts, and Back-Cover Texts)的GNU自由文件许可协议1.2版的条款,复制、传播和/或修改本文件。该协议的副本请见“GNU Free Documentation License”。 | 仅1.2版 |
References used in description
[编辑]
- Kiehl, J. T. and Trenberth, K. E. (1997). "Earth's Annual Global Mean Energy Budget". Bulletin of the American Meteorological Association 78": 197-208.
- Daniel A. Lashof (1989). "The dynamic greenhouse: Feedback processes that may influence future concentrations of atmospheric trace gases and climatic change". Climatic Change 14 (3): 213-242.
- James Hansen, Larissa Nazarenko, Reto Ruedy, Makiko Sato, Josh Willis, Anthony Del Genio, Dorothy Koch, Andrew Lacis, Ken Lo, Surabi Menon, Tica Novakov, Judith Perlwitz, Gary Russell, Gavin A. Schmidt, Nicholas Tausnev (2005). "Earth's Energy Imbalance: Confirmation and Implications". Science 308 (5727): 1431-1435.
文件历史
点击某个日期/时间查看对应时刻的文件。
| 日期/时间 | 缩略图 | 大小 | 用户 | 备注 | |
|---|---|---|---|---|---|
| 当前 | 2021年8月31日 (二) 20:04 | | 750 × 577(21 KB) | Dragons flight(留言 | 贡献) | Revert to earlier version. Change is technically inaccurate. Energy flow balance requires that all forms of energy transfer are included, i.e. the land->atmosphere flow includes not only radiation but also conduction, convection, etc. Also, "heat radiation" appears to be colloquial. |
| 2021年8月22日 (日) 21:35 |  | 750 × 577(21 KB) | Efbrazil(留言 | 贡献) | All heat radiation is now the same color, it is not clear why that was not the case before | |
| 2021年8月22日 (日) 20:31 |  | 750 × 577(21 KB) | Efbrazil(留言 | 贡献) | A few text changes to make things more clear | |
| 2020年4月9日 (四) 17:42 |  | 750 × 577(21 KB) | Efbrazil(留言 | 贡献) | Minor edit, improving alignment of text with larger font for thumbnail view | |
| 2020年3月30日 (一) 17:06 |  | 750 × 577(21 KB) | Efbrazil(留言 | 贡献) | Improved fonts and alignment for thumbnail legibility | |
| 2007年10月25日 (四) 15:00 |  | 750 × 577(21 KB) | Rugby471(留言 | 贡献) | changed width | |
| 2007年10月2日 (二) 17:42 |  | 750 × 577(20 KB) | Rugby471(留言 | 贡献) | == Description == {{en|This figure is a simplified, schematic representation of the flows of energy between space, the atmosphere, and the Earth's surface, and shows how these flows combine to trap heat near the surface and |
您不可以覆盖此文件。
文件用途
以下37个页面使用本文件:
- User:Adeletron 3030/botgalleries/Sports/2021 August 29-31
- User:Glrx
- File:Drivhuseffekt.png
- File:Efecto invernadero.PNG
- File:Efeito estufa.PNG
- File:Efekt cieplarniany schemat 01.svg
- File:Efekt cieplarniany schemat 02.png
- File:Effet de Serre.png
- File:Effet de serre.svg
- File:Greenhouse Effect-bn.svg
- File:Greenhouse Effect-ca.svg
- File:Greenhouse Effect-cs.svg
- File:Greenhouse Effect-da.svg
- File:Greenhouse Effect-fi.png
- File:Greenhouse Effect-gu.svg
- File:Greenhouse Effect-hi.svg
- File:Greenhouse Effect-kn.svg
- File:Greenhouse Effect-no.svg
- File:Greenhouse Effect-ta.svg
- File:Greenhouse Effect-te.svg
- File:Greenhouse Effect.png
- File:Greenhouse Effect.svg
- File:Greenhouse Effect ar.svg
- File:Greenhouse Effect as.svg
- File:Greenhouse Effect el.svg
- File:Greenhouse Effect eo.svg
- File:Greenhouse Effect eu.png
- File:Greenhouse Effect id.png
- File:Greenhouse Effect ja.png
- File:Greenhouse Effect mk.svg
- File:Greenhouse Effect nl.svg
- File:Greenhouse Effect rev es.svg
- File:Greenhouse Effect uk.svg
- File:Greenhouse Effect vn.png
- File:Greenhouse Effect zh-hans.svg
- File:Greenhouse Effects-pa.svg
- Template:Other versions/Greenhouse Effect