File:Greenhouse Gas Emissions by Economic Sector.svg
跳至導覽
跳至搜尋

此 SVG 檔案的 PNG 預覽的大小:750 × 600 像素。 其他解析度:300 × 240 像素 | 600 × 480 像素 | 960 × 768 像素 | 1,280 × 1,024 像素 | 2,560 × 2,048 像素。
原始檔案 (SVG 檔案,表面大小:960 × 768 像素,檔案大小:4 KB)
說明
說明
添加單行說明來描述出檔案所代表的內容
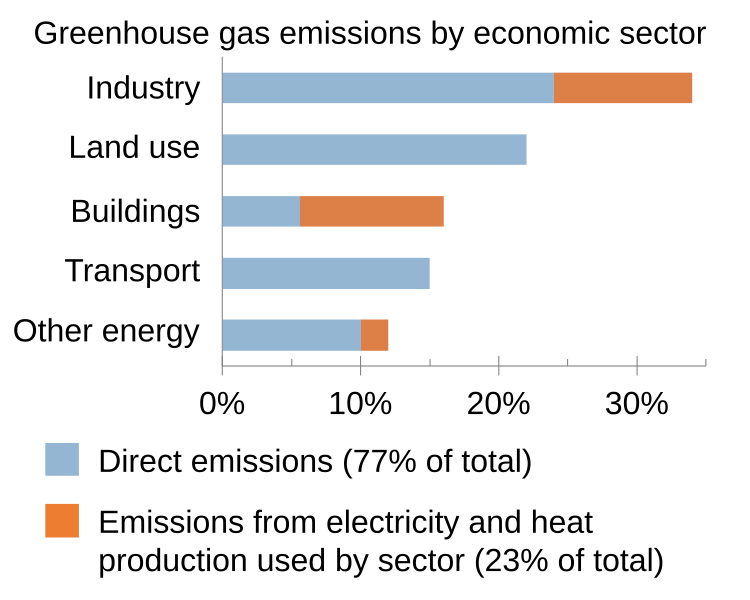
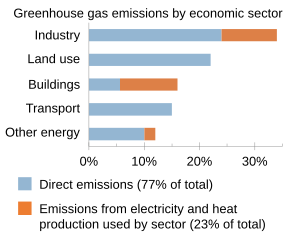
Greenhouse gas emissions by economic sector as of 2019 from IPCC AR6 report
摘要[編輯]
| 描述 |
English: Emissions produced by different economic sectors as of 2019, including emissions generated by electricity and heat production used by the sectors, according to the IPCC AR6 report. Specific source is TS.6 of page 66 of https://www.ipcc.ch/report/ar6/wg3/downloads/report/IPCC_AR6_WGIII_TechnicalSummary.pdf |
| 日期 | |
| 來源 | 自己的作品 |
| 作者 | Efbrazil |
| 其他版本 |
|

授權條款[編輯]
我,本作品的著作權持有者,決定用以下授權條款發佈本作品:
此檔案採用共享創意 姓名標示-相同方式分享 4.0 國際授權條款。
- 您可以自由:
- 分享 – 複製、發佈和傳播本作品
- 重新修改 – 創作演繹作品
- 惟需遵照下列條件:
- 姓名標示 – 您必須指名出正確的製作者,和提供授權條款的連結,以及表示是否有對內容上做出變更。您可以用任何合理的方式來行動,但不得以任何方式表明授權條款是對您許可或是由您所使用。
- 相同方式分享 – 如果您利用本素材進行再混合、轉換或創作,您必須基於如同原先的相同或兼容的條款,來分布您的貢獻成品。
檔案歷史
點選日期/時間以檢視該時間的檔案版本。
| 日期/時間 | 縮圖 | 尺寸 | 用戶 | 備註 | |
|---|---|---|---|---|---|
| 目前 | 2023年5月17日 (三) 18:18 | | 960 × 768(4 KB) | Efbrazil(對話 | 貢獻) | Updated to AR6 data |
| 2021年8月6日 (五) 18:02 |  | 960 × 768(5 KB) | Clonewayx(對話 | 貢獻) | File uploaded using svgtranslate tool (https://svgtranslate.toolforge.org/). Added translation for cs. | |
| 2021年8月6日 (五) 18:01 |  | 960 × 768(5 KB) | Clonewayx(對話 | 貢獻) | File uploaded using svgtranslate tool (https://svgtranslate.toolforge.org/). Added translation for cs. | |
| 2021年8月6日 (五) 18:00 |  | 960 × 768(5 KB) | Clonewayx(對話 | 貢獻) | File uploaded using svgtranslate tool (https://svgtranslate.toolforge.org/). Added translation for cs. | |
| 2020年5月13日 (三) 16:13 |  | 960 × 768(4 KB) | Nyq(對話 | 貢獻) | Decapitalized common nouns | |
| 2020年3月30日 (一) 17:31 |  | 960 × 768(4 KB) | Efbrazil(對話 | 貢獻) | removing awkward agriculture, forestry subtext | |
| 2020年3月9日 (一) 19:56 |  | 960 × 768(4 KB) | Efbrazil(對話 | 貢獻) | font tweaks | |
| 2020年3月9日 (一) 19:49 |  | 960 × 768(4 KB) | Efbrazil(對話 | 貢獻) | Uploaded own work with UploadWizard |
無法覆蓋此檔案。
檔案用途
下列3個頁面有用到此檔案:
.png)
全域檔案使用狀況
以下其他 wiki 使用了這個檔案:
- ar.wikipedia.org 的使用狀況
- az.wikipedia.org 的使用狀況
- bn.wikipedia.org 的使用狀況
- el.wikipedia.org 的使用狀況
- en.wikipedia.org 的使用狀況
- es.wikipedia.org 的使用狀況
- fa.wikipedia.org 的使用狀況
- ig.wikipedia.org 的使用狀況
- ig.wiktionary.org 的使用狀況
- ko.wikipedia.org 的使用狀況
- rw.wikipedia.org 的使用狀況
- tn.wikipedia.org 的使用狀況
- tr.wikipedia.org 的使用狀況
- zh.wikipedia.org 的使用狀況