File:Greenhouse Gas by Sector.png
跳转到导航
跳转到搜索

本预览的尺寸:600 × 600像素。 其他分辨率:240 × 240像素 | 480 × 480像素 | 768 × 768像素 | 1,024 × 1,024像素 | 1,632 × 1,632像素。
原始文件 (1,632 × 1,632像素,文件大小:366 KB,MIME类型:image/png)
说明
说明
添加一行文字以描述该文件所表现的内容

|
File:Greenhouse gas by sector 2000.svg是此文件的矢量版本。 如果此文件质量不低于原点阵图,就应该将这个PNG格式文件替换为此文件。
File:Greenhouse Gas by Sector.png → File:Greenhouse gas by sector 2000.svg
更多信息请参阅Help:SVG/zh。 |
 |
摘要[编辑]
| 描述 |
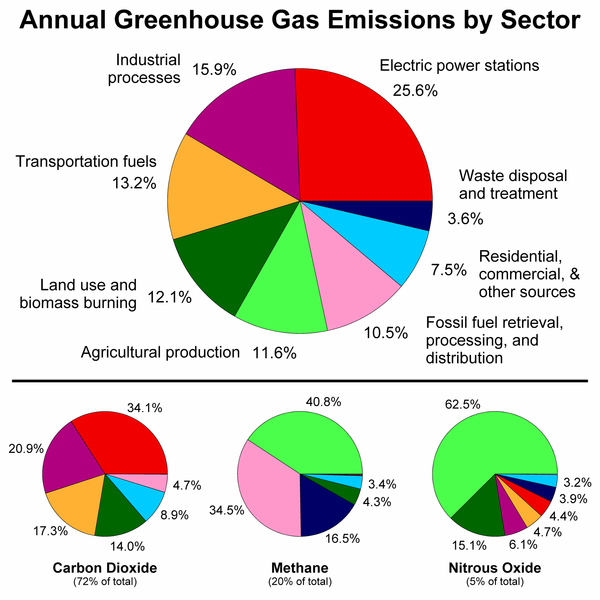
English: This figure shows the relative fraction of man-made greenhouse gases coming from each of eight categories of sources, as estimated by the Emission Database for Global Atmospheric Research version 4.2, fast track 2010 project [1]. These values are intended to provide a snapshot of global annual greenhouse gas emissions in the year 2000.
The top panel shows the sum over all anthropogenic greenhouse gases, weighted by their global warming potential over the next 100 years. This consists of 72% carbon dioxide, 20% methane, 5% nitrous oxide and 3% all other gases. Lower panels show the comparable information for each of these three primary greenhouse gases, with the same coloring of sectors as used in the top chart. Segments with less than 1% fraction are not labeled.
עברית: תמונה זו מראה את החלוקה היחסית של פליטות גזי חממה מעשה ידי אדם, על פי 8 קטגוריות של מקורות, כפי שהדבר מוערך על ידי w:Emission Database for Global Atmospheric Research version 4.2, fast track 2010 project [2].
ערכים אלו אמורים לספק תמונת מצב של שנת 2000. הפנל העליון מראה את סך הפליטות של גזי חממה כשהם נשקלים על פי פוטנציאל אפקט החממה שלהם במשך 100 השנים הבאות. זה מורכב מ 72% של he:פחמן דו חמצני, 20% he:מתאן, 5% he:תחמוצת החנקן, ו3% גזים אחרים. הפנלים התחתונים מראים את ההשוואה היחסית של כל אחד מהגזים האלה, עם אותים צבעים לסקטורים שונים כמו בפנל העליון. סמגנטים עם תרומה נמוכה מ 1% אינם מסומנים. |
| 来源 | 自己的作品 |
| 作者 | Robert A. Rohde |
| 其他版本 |
此文件衍生的作品: |

许可协议[编辑]
This figure was prepared by Robert A. Rohde from publicly available data and is part of the Global Warming Art project.
Image from Global Warming Art
This image is an original work created for Global Warming Art. Please refer to the image description page for more information.

|
已授权您依据自由软件基金会发行的无固定段落及封面封底文字(Invariant Sections, Front-Cover Texts, and Back-Cover Texts)的GNU自由文件许可协议1.2版或任意后续版本的条款,复制、传播和/或修改本文件。该协议的副本请见“GNU Free Documentation License”。 |
| 本文件采用知识共享署名-相同方式共享 3.0 未本地化版本许可协议授权。 | ||
| ||
| 本许可协议标签作为GFDL许可协议更新的组成部分被添加至本文件。 |
文件历史
点击某个日期/时间查看对应时刻的文件。
| 日期/时间 | 缩略图 | 大小 | 用户 | 备注 | |
|---|---|---|---|---|---|
| 当前 | 2019年3月14日 (四) 07:42 | | 1,632 × 1,632(366 KB) | Dragons flight(留言 | 贡献) | Some suggested tweaks in category labels |
| 2019年3月13日 (三) 12:04 |  | 1,632 × 1,632(366 KB) | Dragons flight(留言 | 贡献) | Updates diagram to use the EDGAR 4.2 FT2010 values for the year 2010 | |
| 2006年11月23日 (四) 17:36 |  | 650 × 603(33 KB) | Xiaowei(留言 | 贡献) | == Description == This figure shows the relative fraction of man-made greenhouse gases coming from each of eight categories of sources, as estimated by the Emission Database for Global Atmospheric Research version 3.2, fast track 2000 project [ht |
您不可以覆盖此文件。
文件用途
以下3个页面使用本文件:
全域文件用途
以下其他wiki使用此文件:
- ar.wikipedia.org上的用途
- de.wikipedia.org上的用途
- en.wikipedia.org上的用途
- fa.wikipedia.org上的用途
- fr.wikipedia.org上的用途
- ga.wikipedia.org上的用途
- gu.wikipedia.org上的用途
- hi.wikipedia.org上的用途
- hr.wikipedia.org上的用途
- hu.wikipedia.org上的用途
- ja.wikipedia.org上的用途
- kn.wikipedia.org上的用途
- ko.wikipedia.org上的用途
- nl.wikipedia.org上的用途
- sh.wikipedia.org上的用途
- sl.wikipedia.org上的用途
- sq.wikipedia.org上的用途
- ta.wikipedia.org上的用途
- th.wikipedia.org上的用途
- vi.wikipedia.org上的用途
- zh-min-nan.wikipedia.org上的用途
- zh.wikipedia.org上的用途