File:Greenhouse gas emissions per energy source.png

原始檔案 (1,688 × 1,041 像素,檔案大小:118 KB,MIME 類型:image/png)
說明
說明
摘要
[編輯]| 描述 |
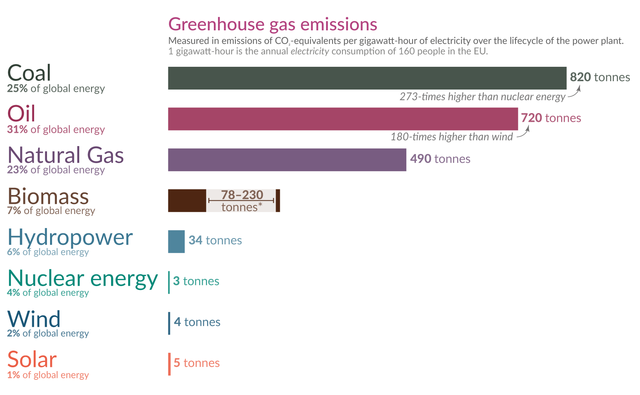
English: The world’s energy supply today is neither safe nor sustainable. What can we do to change this and make progress against this twin-problem of the status quo?
To see the way forward we have to understand the present. Today fossil fuels – coal, oil, and gas – account for 79% of the world’s energy production and as the chart below shows they have very large negative side effects. The bars to the left show the number of deaths and the bars on the right compare the greenhouse gas emissions. My colleague Hannah Ritchie explains the data in this chart in detail in her post ‘What are the safest sources of energy?’. This makes two things very clear. As the burning of fossil fuels accounts for 87% of the world’s CO2 emissions, a world run on fossil fuels is not sustainable, they endanger the lives and livelihoods of future generations and the biosphere around us. And the very same energy sources lead to the deaths of many people right now – the air pollution from burning fossil fuels kills 3.6 million people in countries around the world every year; this is 6-times the annual death toll of all murders, war deaths, and terrorist attacks combined. It is important to keep in mind that electric energy is only one of several forms of energy that humanity relies on; the transition to low-carbon energy is therefore a bigger task than the transition to low-carbon electricity. What the chart makes clear is that the alternatives to fossil fuels – renewable energy sources and nuclear power – are orders of magnitude safer and cleaner than fossil fuels. |
| 日期 | |
| 來源 | https://ourworldindata.org/cheap-renewables-growth |
| 作者 | Our World In Data - Max Roser |
| 其他版本 |

授權條款
[編輯]
- 您可以自由:
- 分享 – 複製、發佈和傳播本作品
- 重新修改 – 創作演繹作品
- 惟需遵照下列條件:
- 姓名標示 – 您必須指名出正確的製作者,和提供授權條款的連結,以及表示是否有對內容上做出變更。您可以用任何合理的方式來行動,但不得以任何方式表明授權條款是對您許可或是由您所使用。
- 相同方式分享 – 如果您利用本素材進行再混合、轉換或創作,您必須基於如同原先的相同或兼容的條款,來分布您的貢獻成品。
檔案歷史
點選日期/時間以檢視該時間的檔案版本。
| 日期/時間 | 縮圖 | 尺寸 | 用戶 | 備註 | |
|---|---|---|---|---|---|
| 目前 | 2023年3月25日 (六) 13:13 | | 1,688 × 1,041(118 KB) | PJ Geest(對話 | 貢獻) | File:5-Bar-chart-–-What-is-the-safest-form-of-energy.png cropped 36 % horizontally, 26 % vertically using CropTool with precise mode. |
無法覆蓋此檔案。
檔案用途
沒有使用此檔案的頁面。
全域檔案使用狀況
以下其他 wiki 使用了這個檔案:
- cs.wikipedia.org 的使用狀況
- de.wikipedia.org 的使用狀況
- en.wikipedia.org 的使用狀況
- es.wikipedia.org 的使用狀況
- fa.wikipedia.org 的使用狀況
- fr.wikipedia.org 的使用狀況
- nl.wikipedia.org 的使用狀況
- uk.wikipedia.org 的使用狀況
- zh.wikipedia.org 的使用狀況