File:Greenland Albedo Change.png
Skočit na navigaci
Skočit na vyhledávání
Velikost tohoto náhledu: 544 × 599 pixelů. Jiná rozlišení: 218 × 240 pixelů | 436 × 480 pixelů | 697 × 768 pixelů | 930 × 1 024 pixelů | 1 438 × 1 584 pixelů.
Původní soubor (1 438 × 1 584 pixelů, velikost souboru: 1,49 MB, MIME typ: image/png)
Popisky
Popisky
Přidejte jednořádkové vysvětlení, co tento soubor představuje
Popis
[editovat]
| Popis |
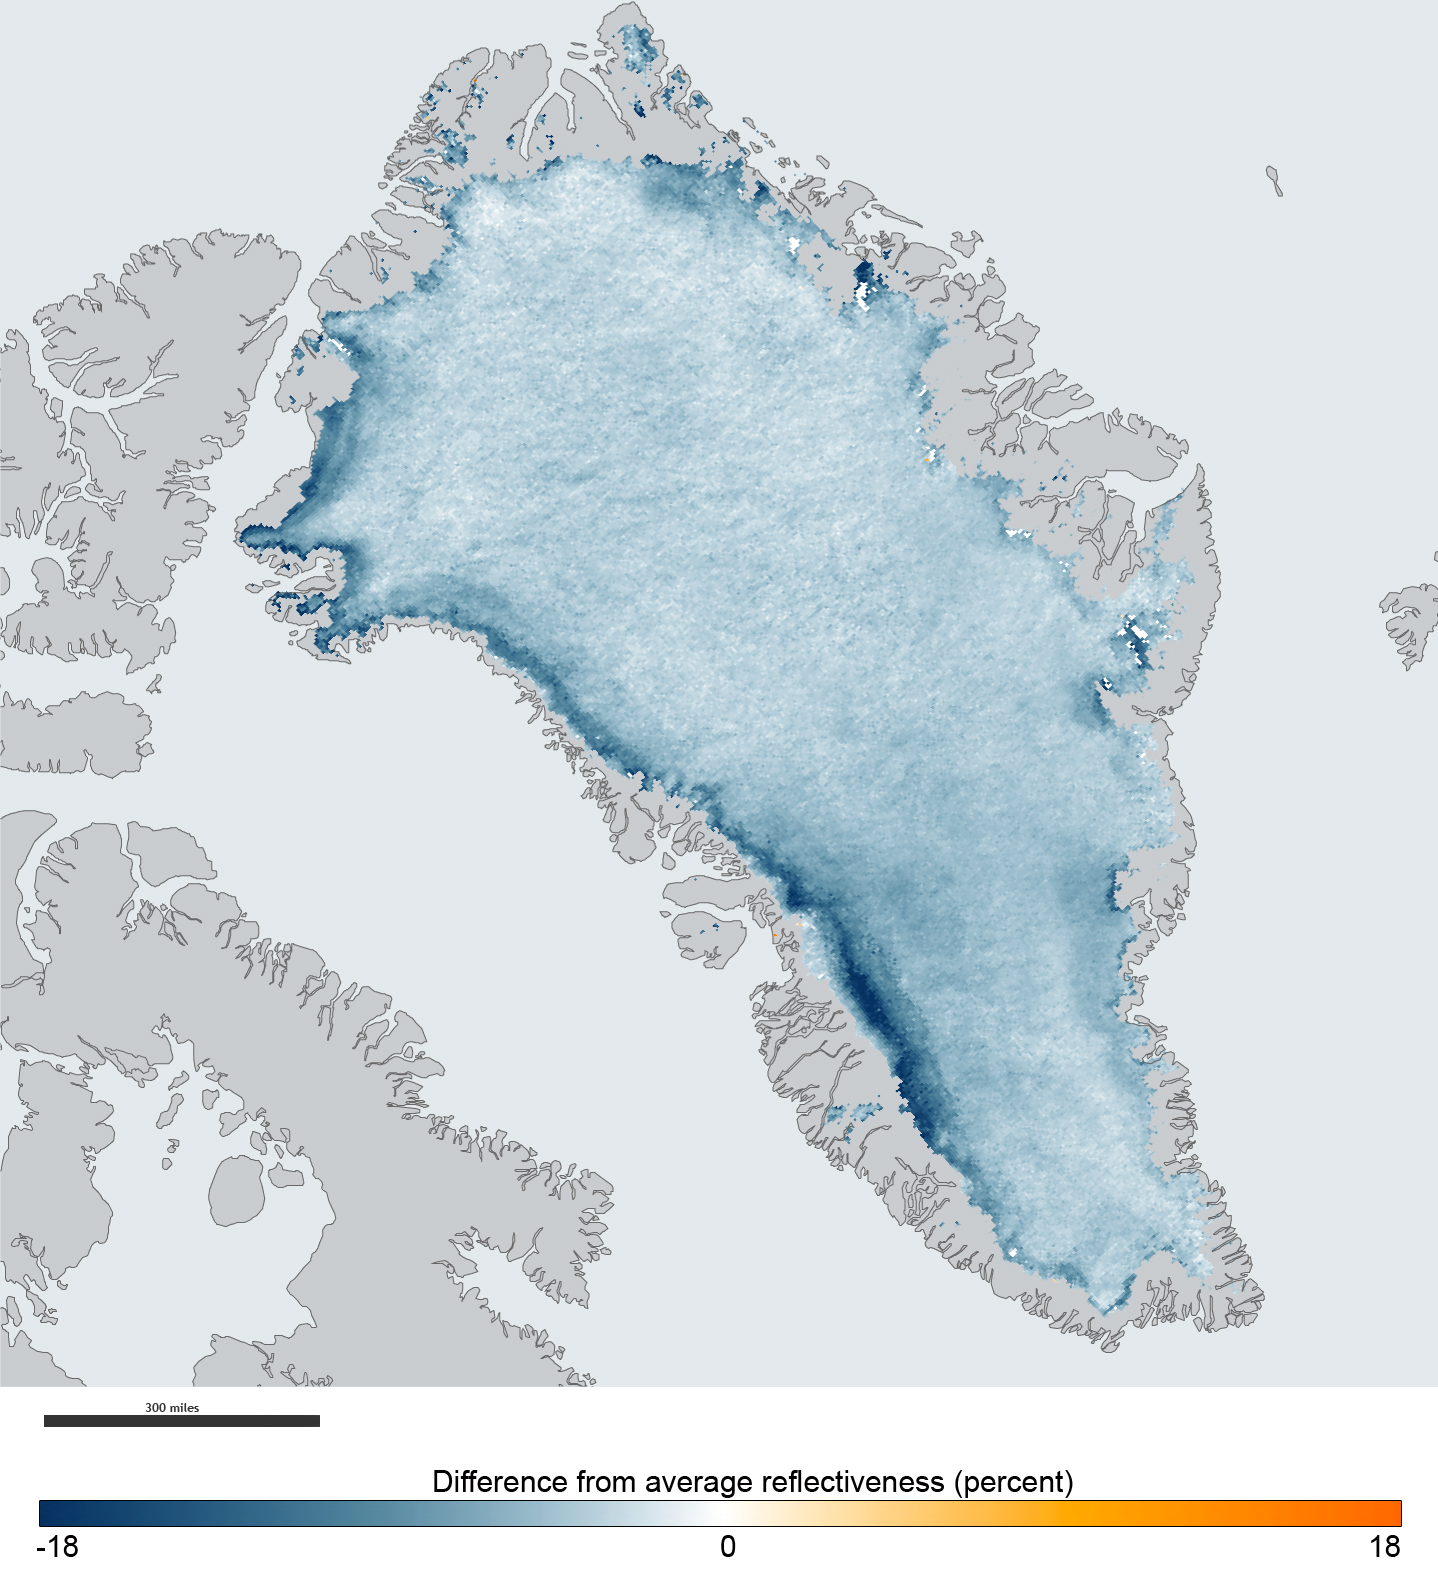
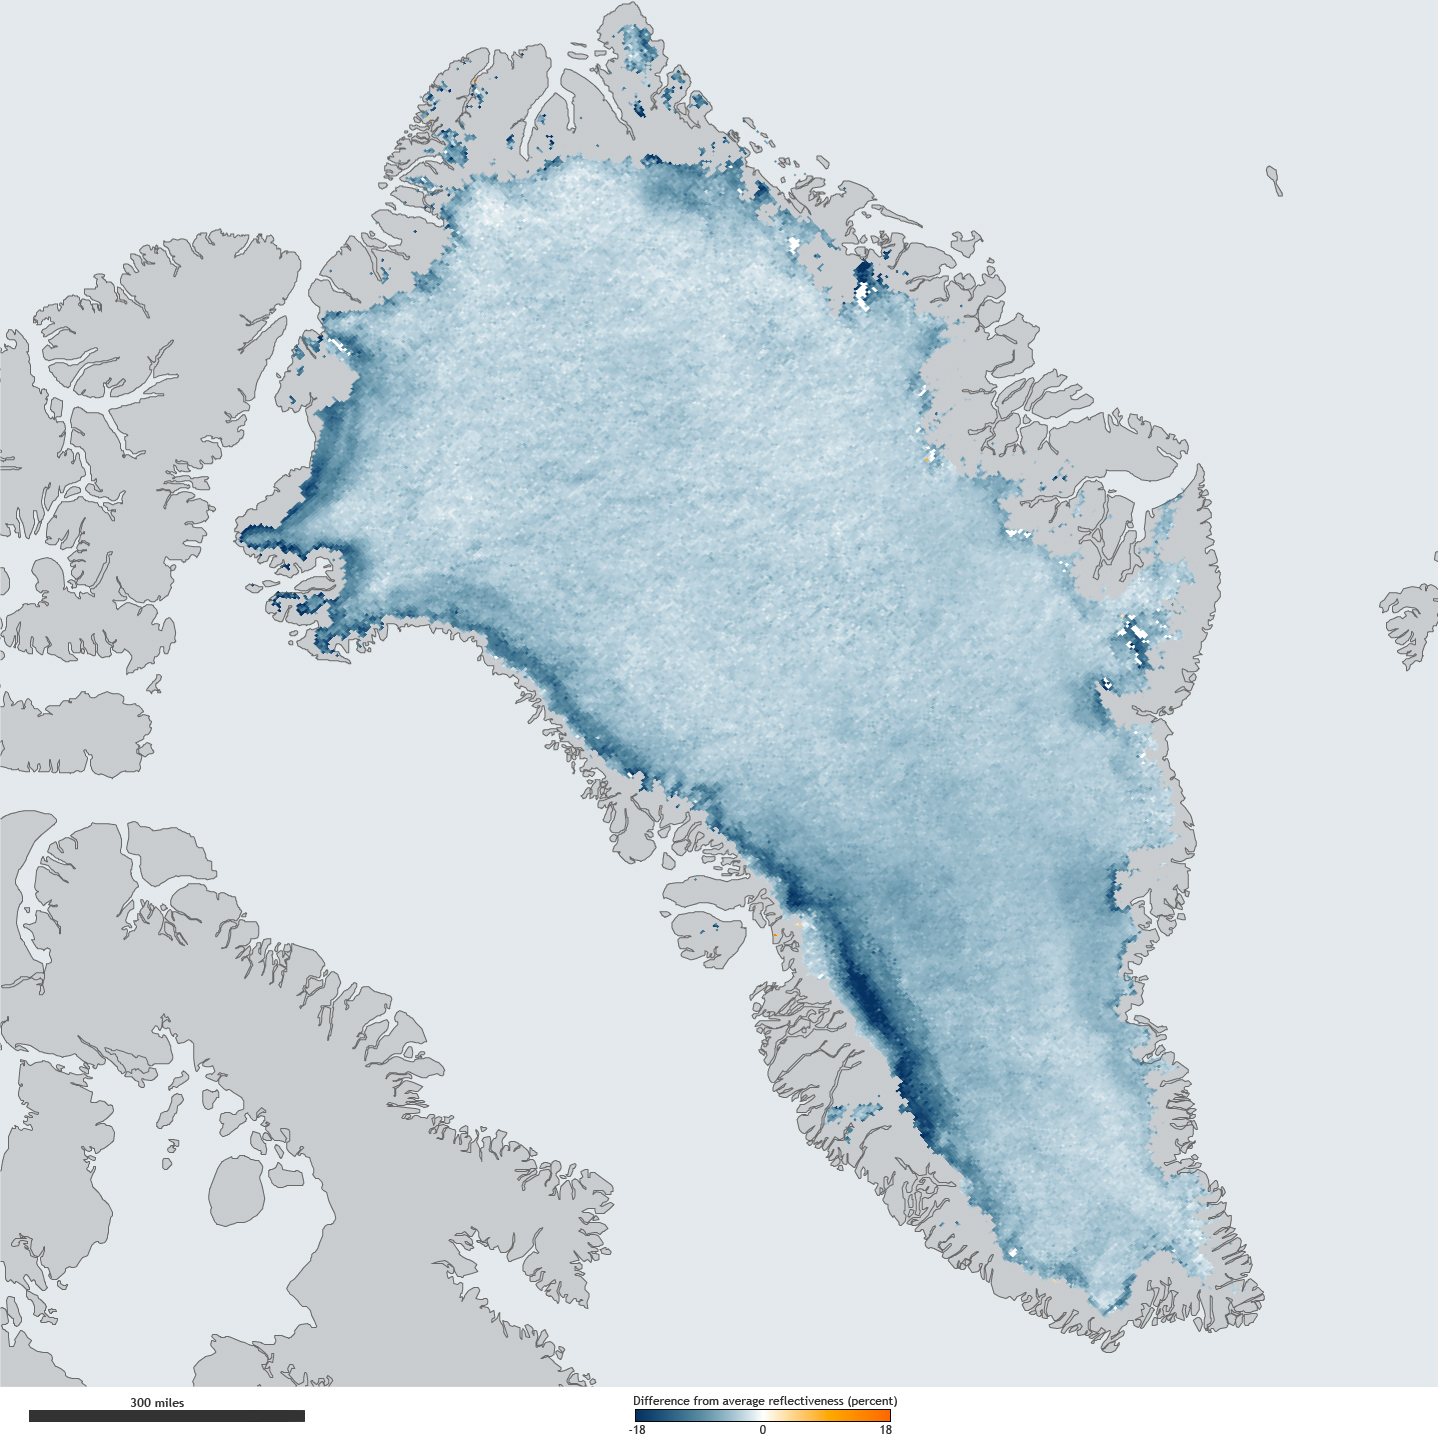
English: The map shows the difference between the amount of sunlight Greenland reflected in the summer of 2011 versus the average percent it reflected between 2000 to 2006. Virtually the entire ice sheet shows some change, with some areas reflecting close to 20 percent less light than a decade ago. The map is based on observations from the Moderate Resolution Imaging Spectroradiometer (MODIS) instruments on NASA’s Terra and Aqua satellites. It was produced as part of the National Oceanic and Atmospheric Administration’s Arctic Report Card. |
| Datum | |
| Zdroj | http://earthobservatory.nasa.gov/IOTD/view.php?id=76916 http://eoimages.gsfc.nasa.gov/images/imagerecords/76000/76916/greenlandalbedo_mod_2011_lrg.jpg |
| Autor | Map by NOAA’s climate.gov team, based on NASA satellite data processed by Jason Box, Byrd Polar Research Center, the Ohio State University. Scanning electron microscope photos courtesy the Electron and Confocal Microscopy Laboratory, USDA Agricultural Research Service. |
Licence
[editovat]
| This file is in the public domain in the United States because it was solely created by NASA. NASA copyright policy states that "NASA material is not protected by copyright unless noted". (See Template:PD-USGov, NASA copyright policy page or JPL Image Use Policy.) | ||
 |
Warnings:
|
Historie souboru
Kliknutím na datum a čas se zobrazí tehdejší verze souboru.
| Datum a čas | Náhled | Rozměry | Uživatel | Komentář | |
|---|---|---|---|---|---|
| současná | 12. 2. 2012, 19:00 | | 1 438 × 1 584 (1,49 MB) | Sagredo (diskuse | příspěvky) |
Tento soubor nemůžete přepsat.
Využití souboru
Na tento soubor neodkazuje na Commons žádná stránka.
Globální využití souboru
Tento soubor využívají následující wiki:
- Využití na bn.wikipedia.org
- Využití na cs.wikipedia.org
- Využití na de.wikipedia.org
- Využití na en.wikipedia.org
- Využití na es.wikipedia.org
- Využití na eu.wikipedia.org
- Využití na fr.wikipedia.org
- Využití na ga.wikipedia.org
- Využití na id.wikipedia.org
- Využití na it.wikipedia.org
- Využití na nl.wikipedia.org
- Využití na no.wikipedia.org
- Využití na pl.wikipedia.org
- Využití na vi.wikipedia.org
- Využití na zh.wikipedia.org