File:Greenland ice sheet temperatures Vinther et al 2009.png

Fichier d’origine (2 006 × 1 129 pixels, taille du fichier : 472 kio, type MIME : image/png)
Légendes
Légendes

|
Cette image (de type graphique) devrait être recréée dans un format vectoriel, en tant que fichier SVG. Cela offrirait plusieurs avantages : voir Commons:Media for cleanup pour plus d'informations. Si une version SVG de cette image est déjà disponible, merci de bien vouloir l'envoyer. Après cela, remplacez ce modèle par {{vector version available|nouveau nom d'image.svg}}.
|
Description
[modifier]
| Description |
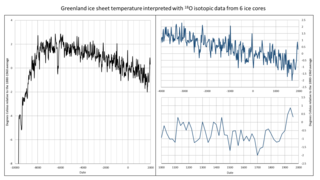
English: The temperature reconstruction produced using data from all six ice cores is shown by the black line in the attached figure, and spans the period from 9690BC to AD1970. The blue lines represent two focus on the dataset, first on the Late Holocene (or Meghalayan) and then on the last millenium. It has a resolution of around 20 years, meaning that each data point represents the average temperature of the surrounding 20 years. So, the end of the record – 1970 – shows the average temperature between 1960 and 1980.
The original data for the creation of these figures have been downloaded from the NOAA website: ftp://ftp.ncdc.noaa.gov/pub/data/paleo/icecore/greenland/vinther2009greenland.txt ORIGINAL REFERENCE: Vinther, B.M., S.L. Buchardt, H.B. Clausen, D. Dahl-Jensen, S.J. Johnsen, D.A. Fisher, R.M. Koerner, D. Raynaud, V. Lipenkov, K.K. Andersen, T. Blunier, S.O. Rasmussen, J.P. Steffensen, and A.M. Svensson. 2009. Holocene thinning of the Greenland ice sheet. Nature, Vol. 461, pp. 385-388, 17 September 2009. doi:10.1038/nature08355 SEE ALSO: Factcheck: What Greenland ice cores say about past and present climate change https://www.carbonbrief.org/factcheck-what-greenland-ice-cores-say-about-past-and-present-climate-change |
| Date | |
| Source | Travail personnel |
| Auteur | Ambactos55 |
I made these figures to propose a correct version of the previous figure made by Artreve. His version used incorrectly the stated baseline (1880-1960 average) and missed the last centuries from the dataset.
Conditions d’utilisation
[modifier]
- Vous êtes libre :
- de partager – de copier, distribuer et transmettre cette œuvre
- d’adapter – de modifier cette œuvre
- Sous les conditions suivantes :
- paternité – Vous devez donner les informations appropriées concernant l'auteur, fournir un lien vers la licence et indiquer si des modifications ont été faites. Vous pouvez faire cela par tout moyen raisonnable, mais en aucune façon suggérant que l’auteur vous soutient ou approuve l’utilisation que vous en faites.
Historique du fichier
Cliquer sur une date et heure pour voir le fichier tel qu'il était à ce moment-là.
| Date et heure | Vignette | Dimensions | Utilisateur | Commentaire | |
|---|---|---|---|---|---|
| actuel | 23 janvier 2020 à 18:05 | | 2 006 × 1 129 (472 kio) | Ambactos55 (d | contributions) | Better frame and clipping. |
| 23 janvier 2020 à 17:45 |  | 1 937 × 1 090 (268 kio) | Ambactos55 (d | contributions) | {{Information |description ={{en|1=The temperature reconstruction produced using data from all six ice cores is shown by the black line in the attached figure, and spans the period from 9690BC to AD1970. The blue lines represent two focus on the dataset, first on the Late Holocene (or Meghalayan) and then on the last millenium. It has a resolution of around 20 years, meaning that each data point represents the average temperature of the surrounding 20 years. So, the end of the record – 1970... |
Vous ne pouvez pas remplacer ce fichier.
Utilisations locales du fichier
Aucune page n’utilise ce fichier.
Utilisations du fichier sur d’autres wikis
Les autres wikis suivants utilisent ce fichier :
- Utilisation sur ar.wikipedia.org
- Utilisation sur en.wikipedia.org
- Utilisation sur es.wikipedia.org
- Utilisation sur fr.wikipedia.org
- Utilisation sur ig.wikipedia.org
- Utilisation sur tr.wikipedia.org
- Utilisation sur zh.wikipedia.org