File:Haplogrupo N (ADN-Y).PNG
跳转到导航
跳转到搜索

本预览的尺寸:800 × 458像素。 其他分辨率:320 × 183像素 | 640 × 366像素 | 953 × 545像素。
原始文件 (953 × 545像素,文件大小:76 KB,MIME类型:image/png)
说明
说明
添加一行文字以描述该文件所表现的内容

|
此map图片可使用矢量图形重新创建为SVG文件。这具有很多好处;更多信息请参见共享资源:待清理媒体。如果存在此图片的SVG格式,请将其上传,然后将此模板替换为
{{vector version available|新图片名称}}。
建议您将SVG命名为“Haplogrupo N (ADN-Y).svg”,这样在使用Vector version available(或Vva)模板时就不需要填写新图片名称参数。 |
摘要[编辑]
.PNG&action=edit§ion=1)
| 描述 |
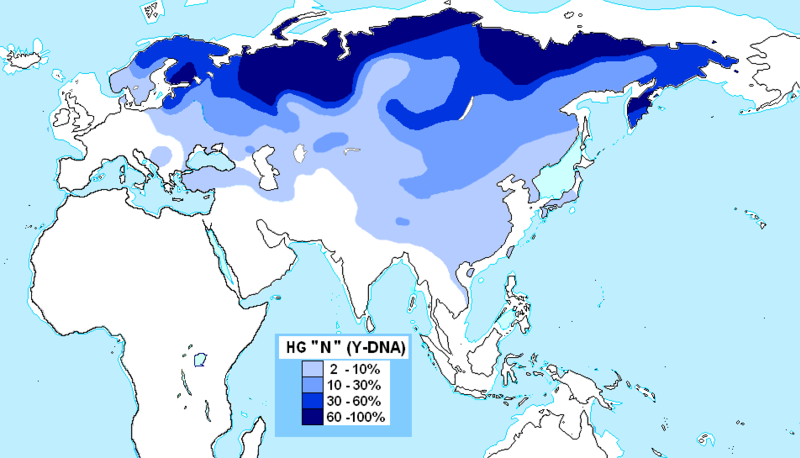
English: Haplogroup N (Y-DNA) distribution
Español: Distribución del haplogrupo N (ADN-Y) en poblaciones nativas |
| 日期 | |
| 来源 | 自己的作品 |
| 作者 | Maulucioni |
许可协议[编辑]
.PNG&action=edit§ion=2)
我,本作品著作权人,特此采用以下许可协议发表本作品:

|
已授权您依据自由软件基金会发行的无固定段落及封面封底文字(Invariant Sections, Front-Cover Texts, and Back-Cover Texts)的GNU自由文件许可协议1.2版或任意后续版本的条款,复制、传播和/或修改本文件。该协议的副本请见“GNU Free Documentation License”。 |
本文件采用知识共享署名 3.0 未本地化版本许可协议授权。
- 您可以自由地:
- 共享 – 复制、发行并传播本作品
- 修改 – 改编作品
- 惟须遵守下列条件:
- 署名 – 您必须对作品进行署名,提供授权条款的链接,并说明是否对原始内容进行了更改。您可以用任何合理的方式来署名,但不得以任何方式表明许可人认可您或您的使用。
您可以选择您需要的许可协议。
文件历史
点击某个日期/时间查看对应时刻的文件。
.PNG&uselang=zh-hans&dir=prev)
.PNG&uselang=zh-hans&offset=20200206113337)
.PNG&uselang=zh-hans&offset=&limit=20)
.PNG&uselang=zh-hans&offset=&limit=50)
.PNG&uselang=zh-hans&offset=&limit=100)
.PNG&uselang=zh-hans&offset=&limit=250)
.PNG&uselang=zh-hans&offset=&limit=500)
| 日期/时间 | 缩略图 | 大小 | 用户 | 备注 | |
|---|---|---|---|---|---|
| 当前 | 2022年4月17日 (日) 08:58 | | 953 × 545(76 KB) | Ebizur(留言 | 贡献) | Haplogroup N-M231 is found in greater than 10% of the population in the whole of Gansu Province in northwestern China. |
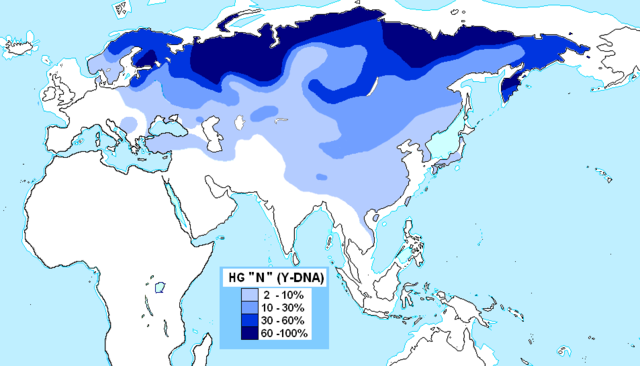
| 2022年4月17日 (日) 08:51 |  | 953 × 545(76 KB) | Ebizur(留言 | 贡献) | Haplogroup N-M231 is found in more than 2% and less than 10% of the population in every province of China except Gansu, where it is found in more than 10% of the population. | |
| 2021年1月8日 (五) 16:58 |  | 953 × 545(77 KB) | ABCymta(留言 | 贡献) | adding Aomori at 7%, Kalmyks at 10,7% and Kazakh tribes Qypshaq 10.3%, Jalair 10.9%, Qozha 16.7%, Syrgeli 65.6%. Tibetans at 5,6%. | |
| 2021年1月2日 (六) 17:14 |  | 953 × 545(72 KB) | Maulucioni(留言 | 贡献) | Revised data from Japan (according to Nonaka 2007), Guangxi Zhuang (Chen 2006), Tatars, Dolgans (Tambets 2004), Khakasia (Illumäe 2016), Kamchatka (Lell 2001), Finland (Lappalainen 2008) | |
| 2021年1月2日 (六) 04:32 |  | 953 × 551(65 KB) | Maulucioni(留言 | 贡献) | Data for Siberia, Uzbekistan, Turkmenistan, Xinjiang, southern China, and Hungary are overestimated, while data for European Russia, Serbia, and Sweden are underestimated. Reverted to version as of 04:30 20 oct 2011 (UTC) | |
| 2020年4月13日 (一) 02:17 | 1,232 × 498(112 KB) | Ebizur(留言 | 贡献) | Edited map to more accurately portray the frequency of Y-DNA Haplogroup N in present-day populations of the Baltic and Eastern Europe. | ||
| 2020年2月6日 (四) 17:07 | 1,232 × 498(114 KB) | LenguaMapa(留言 | 贡献) | Reverted to version as of 15:07, 6 February 2020 (UTC) for now, several studies have different results. I will try to combine the results and use a more "wide resource" | ||
| 2020年2月6日 (四) 16:22 | 1,232 × 498(112 KB) | LenguaMapa(留言 | 贡献) | slightly corrected distribution in europe/anatolia and korea as well as southern central asia (as in map before) | ||
| 2020年2月6日 (四) 15:07 | 1,232 × 498(114 KB) | LenguaMapa(留言 | 贡献) | fixed India (see my last comment) | ||
| 2020年2月6日 (四) 11:33 | 1,232 × 498(114 KB) | LenguaMapa(留言 | 贡献) | Reverted to version as of 21:18, 19 January 2020 (UTC) I will in some hours fix the part on Northern India. Afghanistan and Europe is so more correct. (Regarding India I will include another reference.) |
您不可以覆盖此文件。
文件用途
以下5个页面使用本文件:
全域文件用途
以下其他wiki使用此文件:
- azb.wikipedia.org上的用途
- en.wikipedia.org上的用途
- es.wikipedia.org上的用途
- fi.wikipedia.org上的用途
- fr.wikipedia.org上的用途
- ja.wikipedia.org上的用途
- ko.wikipedia.org上的用途
- mk.wikipedia.org上的用途
- no.wikipedia.org上的用途
- pl.wikipedia.org上的用途
- pt.wikipedia.org上的用途
- ru.wikipedia.org上的用途
- sk.wikipedia.org上的用途
- sr.wikipedia.org上的用途
- sv.wikipedia.org上的用途
- tr.wikipedia.org上的用途
- uk.wikipedia.org上的用途
- zh.wikipedia.org上的用途
.PNG&oldid=705728386)