File:Harmonic oscillator gain.svg
跳转到导航
跳转到搜索

此SVG文件的PNG预览的大小:800 × 600像素。 其他分辨率:320 × 240像素 | 640 × 480像素 | 1,024 × 768像素 | 1,280 × 960像素 | 2,560 × 1,920像素。
原始文件 (SVG文件,尺寸为1,024 × 768像素,文件大小:20 KB)
说明
说明
添加一行文字以描述该文件所表现的内容
摘要[编辑]
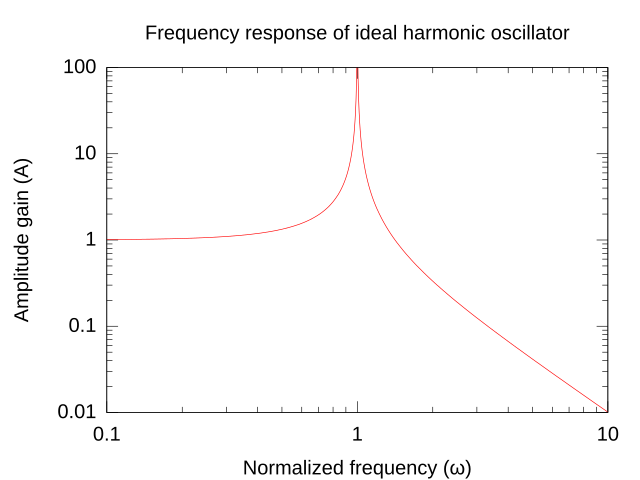
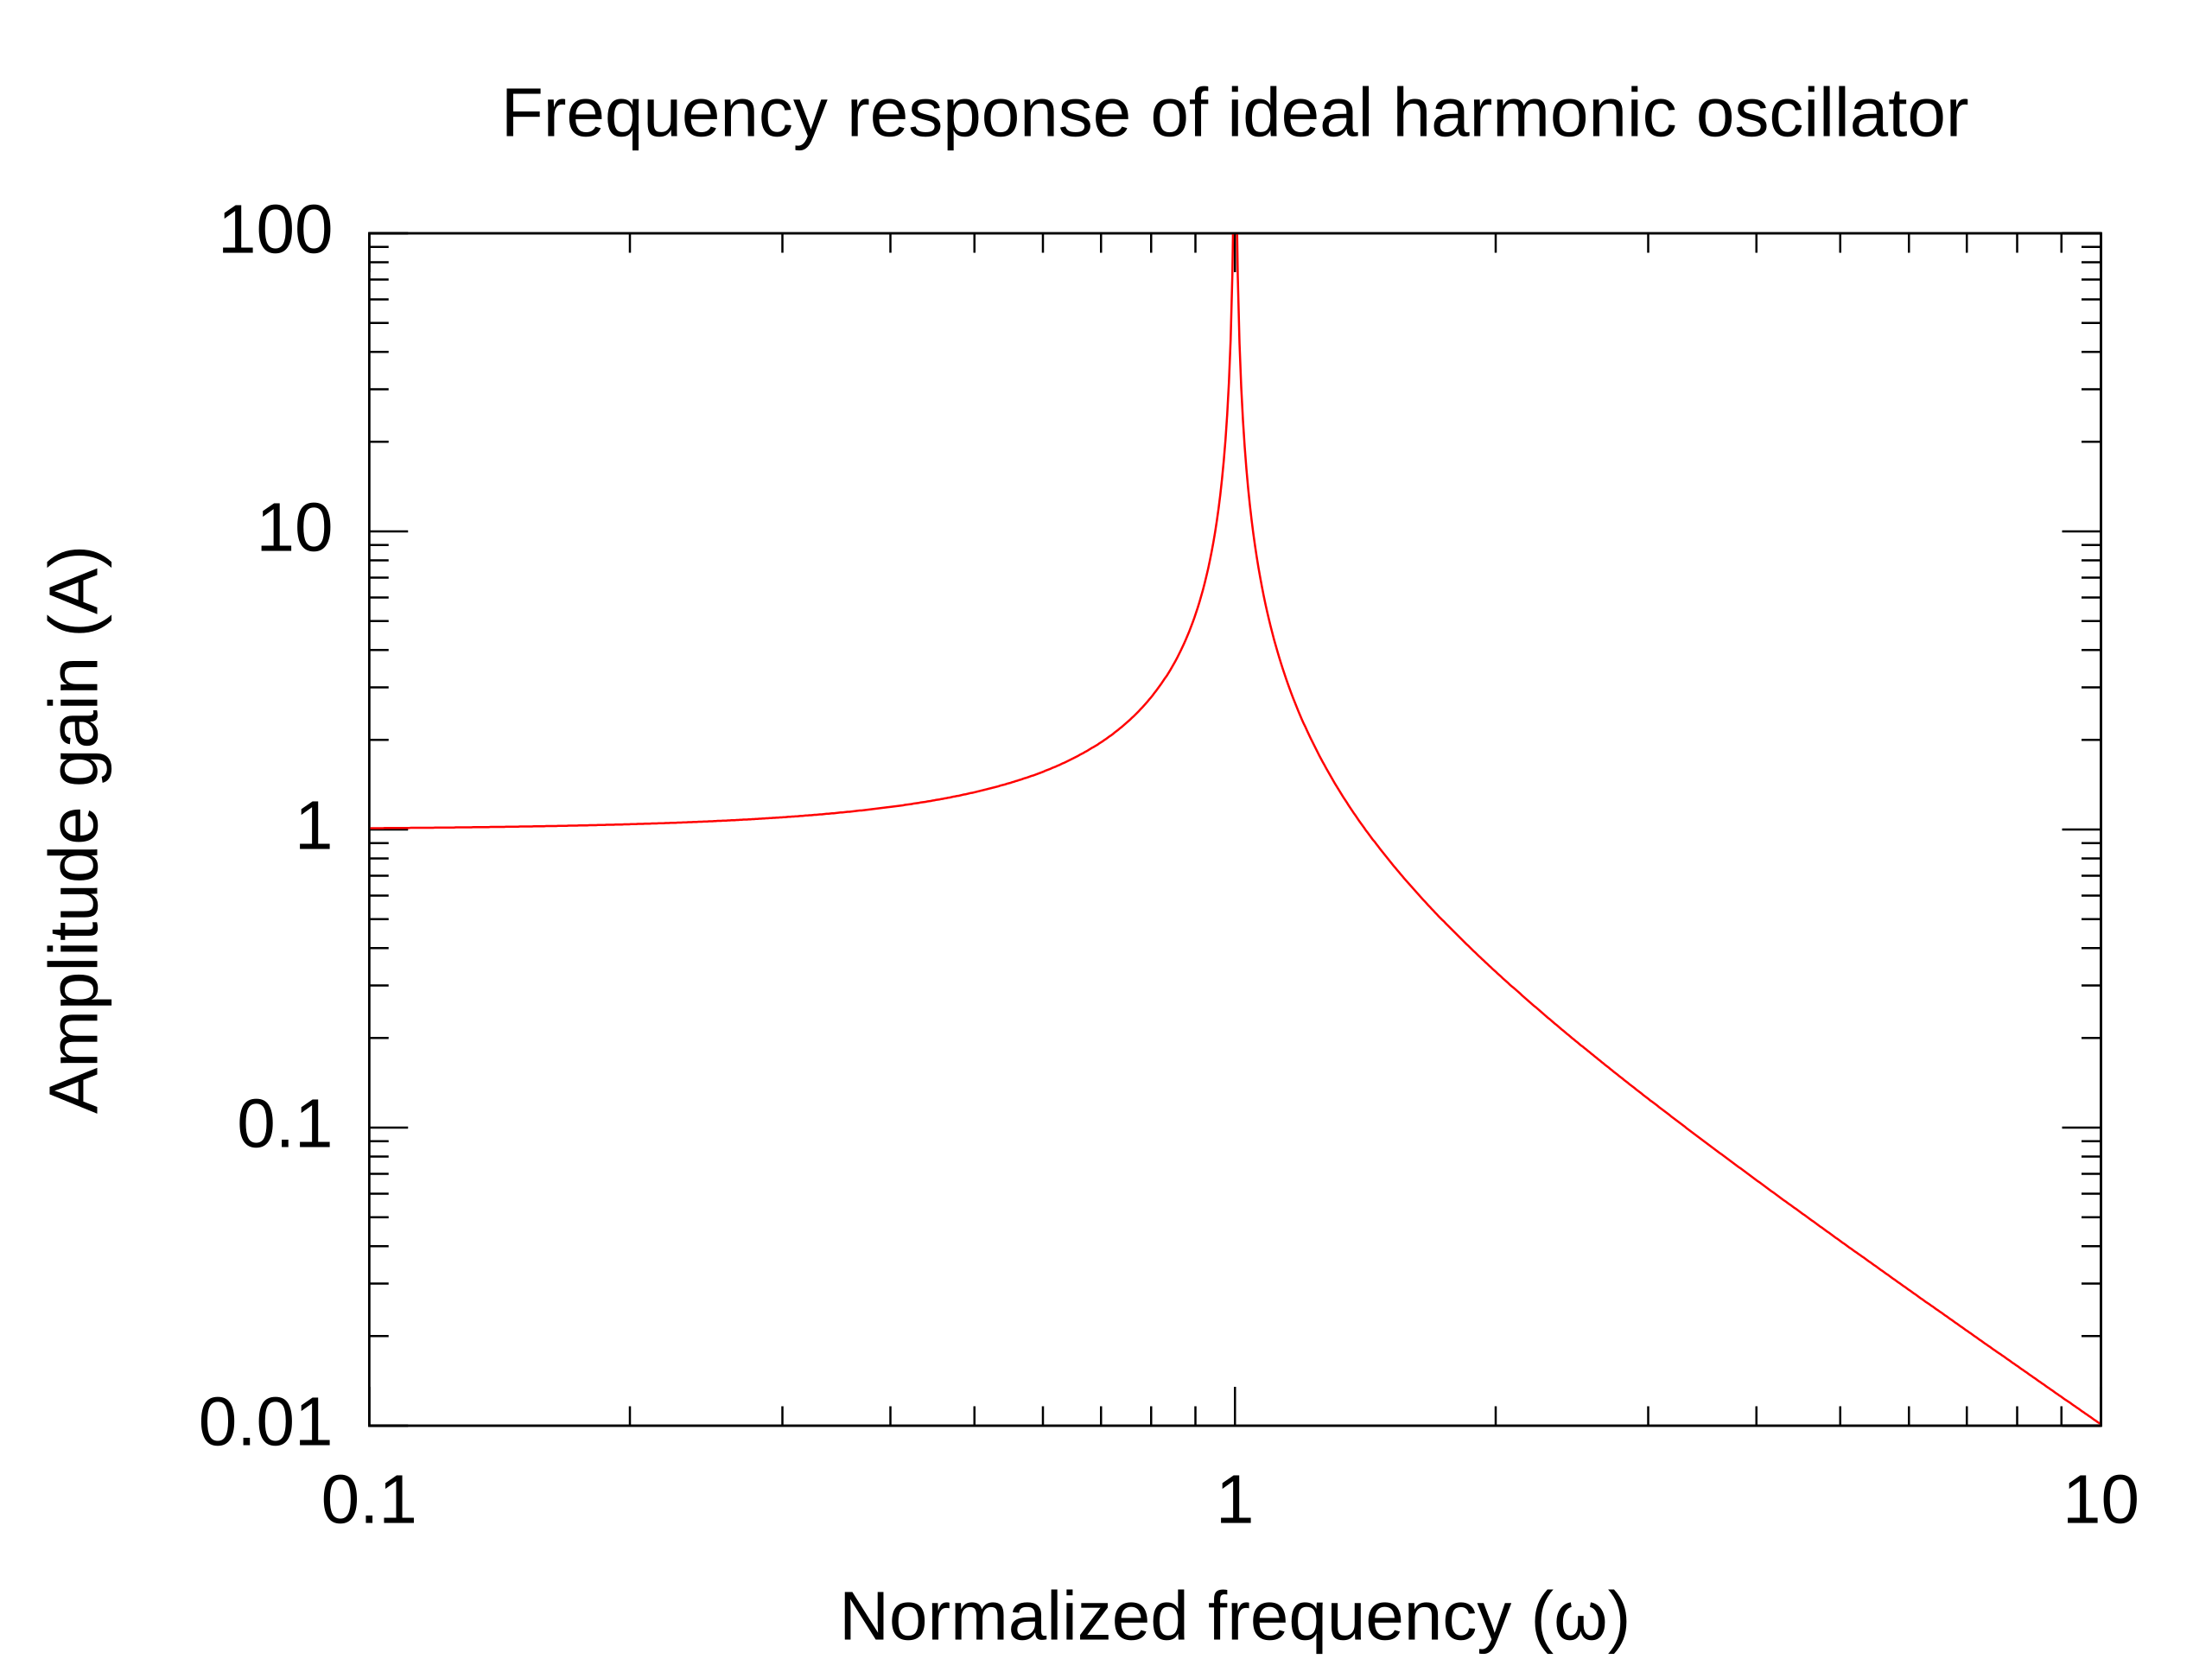
| 描述 | Log-log plot of the frequency response of an ideal harmonic oscillator, made with Gnuplot. The three sections of the graph can be understood as follows: Below resonance, the gain is approximately one, because the oscillator simply follows the driving force, neither amplifying nor attenuating it. Near resonance, the energy builds up inside the oscillator and the gain reaches a maximum (in a real oscillator, the height and sharpness of the peak are limited by the Q factor). At higher frequencies, the oscillator cannot "keep up with" the rapidly varying driving force, so the signal is attenuated more and more (and also shifted 180 degrees out of phase). |
| 日期 | |
| 来源 | 自己的作品 |
| 作者 | Keenan Pepper |
许可协议[编辑]
| 我,本作品著作权人,释出本作品至公有领域。这适用于全世界。 在一些国家这可能不合法;如果是这样的话,那么: 我无条件地授予任何人以任何目的使用本作品的权利,除非这些条件是法律规定所必需的。 |
文件历史
点击某个日期/时间查看对应时刻的文件。
| 日期/时间 | 缩略图 | 大小 | 用户 | 备注 | |
|---|---|---|---|---|---|
| 当前 | 2008年5月11日 (日) 18:35 | | 1,024 × 768(20 KB) | Keenan Pepper(留言 | 贡献) | larger font |
| 2008年5月11日 (日) 18:33 |  | 1,024 × 768(20 KB) | Keenan Pepper(留言 | 贡献) | {{Information |Description=Log-log plot of the frequency response of an ideal harmonic oscillator, made with Gnuplot. The three sections of the graph can be understood as follows: Below resonance, the gain is approximately one, because the oscillator simp |
您不可以覆盖此文件。
文件用途
没有页面使用本文件。
全域文件用途
以下其他wiki使用此文件:
- en.wikipedia.org上的用途
- ja.wikipedia.org上的用途
- mk.wikipedia.org上的用途
- pt.wikipedia.org上的用途
- zh.wikipedia.org上的用途