File:Hilbert transform.png
原始文件 (1,600 × 1,120像素,文件大小:120 KB,MIME类型:image/png)
说明
说明
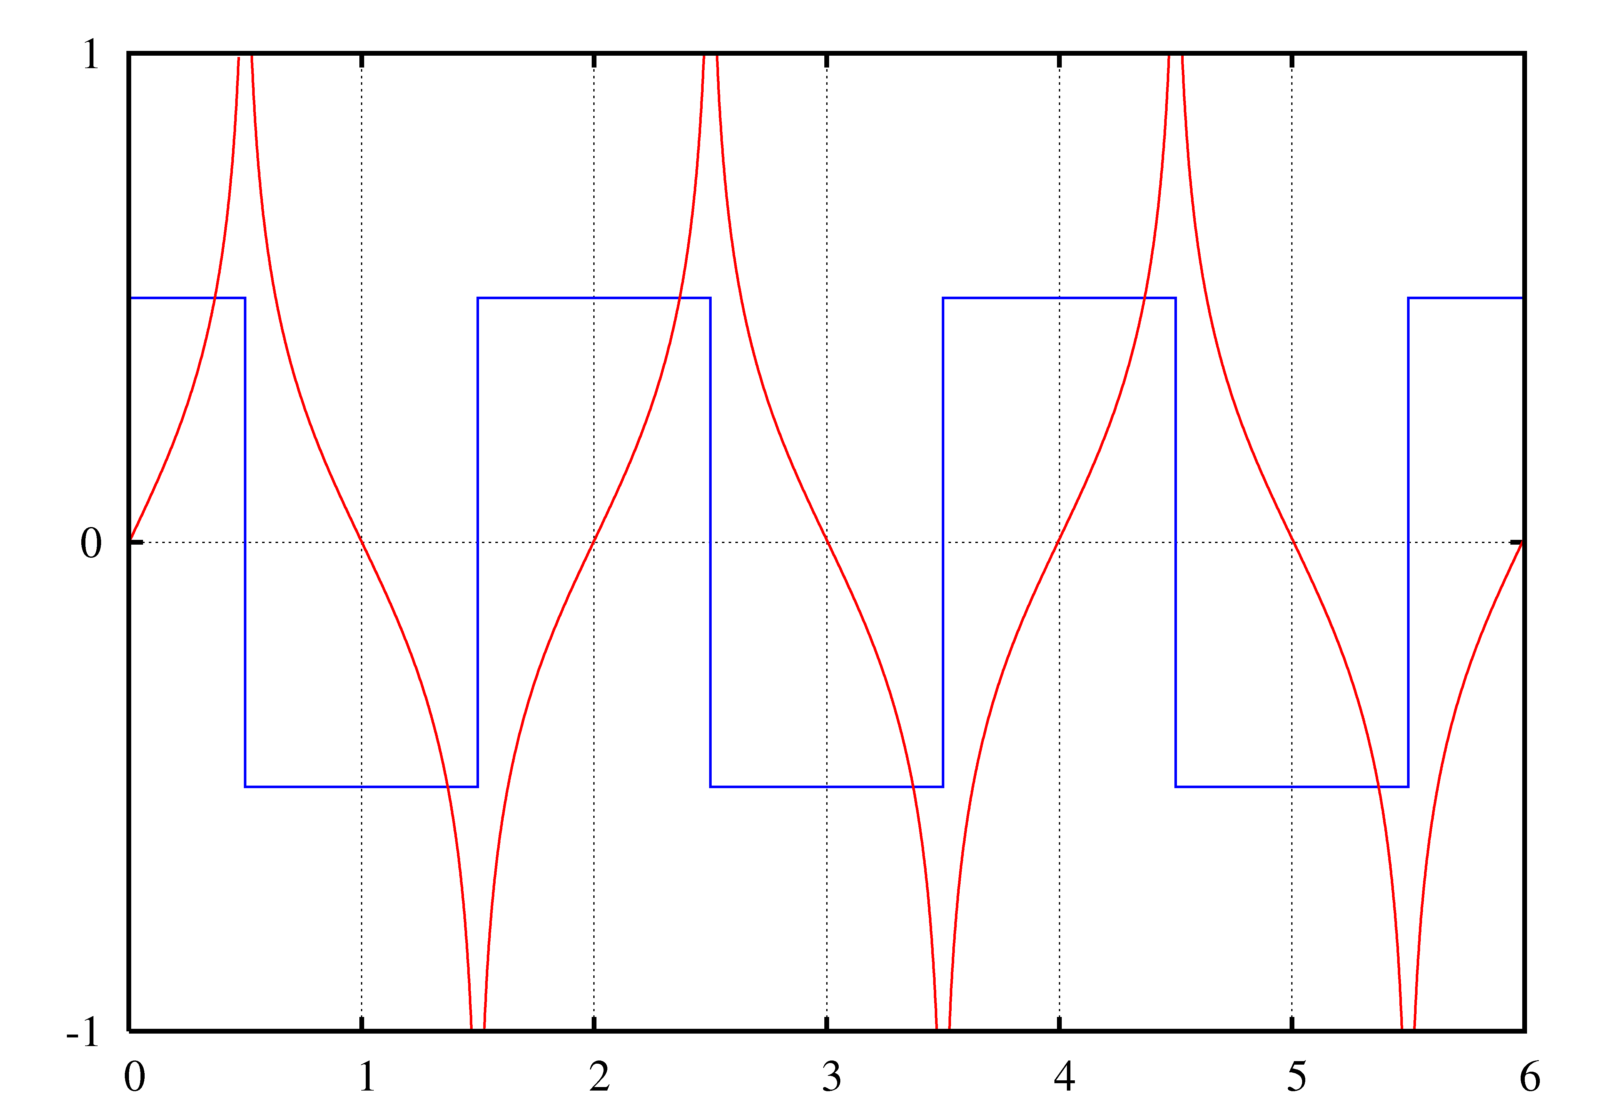
A graph of the Hilbert transform (red) of a square wave (blue).

|
File:Hilbert transform.svg是此文件的矢量版本。 如果此文件质量不低于原点阵图,就应该将这个PNG格式文件替换为此文件。
File:Hilbert transform.png → File:Hilbert transform.svg
更多信息请参阅Help:SVG/zh。 |
 |
Instructions
[编辑]
See Wikipedia graph-making tips.
Plotted in Maxima with the following commands:
u(t) := 1/2*(1+signum(t));
rect(t) := u(t + 1/2) - u(t - 1/2);
A train of rectangular pulses (or a square wave). This should be n=−∞..+∞, but I can't get Maxima to evaluate it, so I just chose n values that would give a close enough approximation for the visible area:
train(t) := sum(rect(t-2*n),n,-10,20);
The Hilbert transform of a rectangular pulse:
hrect(t) := log(abs((t+1/2)/(t-1/2)))/%PI;
A "train" of hrects. Again with the approximation, though this time it actually matters (rectangular function is 0 everywhere; this is not.):
htrain(t) := sum(hrect(t-2*n),n,-100,100);
The plot command:
plot2d([train(t)-0.5,htrain(t)],[t,0,6],[y,-1,1],[nticks,500], [gnuplot_preamble,"set grid; set ytics 1; set nokey"], [gnuplot_ps_term_command,"set term postscript enhanced landscape color solid lw 2 'Times-Roman' 20"], [gnuplot_term,ps], [gnuplot_out_file,"hilbert.ps"]);
This causes gnuplot to create a .ps file.
To convert the PostScript file to PNG:
- Open it in the GIMP (make sure you have ghostscript installed! - Windows instructions)
- Enter 500 under Resolution (it doesn't say "DPI" but I think that's what it means)
- Uncheck Try bounding box (since the bounding box cuts off the edge, unfortunately. You can try with the bounding box first.)
- Enter large values for Width and Height
- Check Color
- Check Strong anti-aliasing for both graphics and text
- Crop off extra whitespace (Shift+C if you can't find it in the toolbox)
- Possibly need to rotate it: Click Image → Transform → Rotate 90 degrees clockwise
Filters → Blur → Gaussian blur at 2.0 px(No need to blur if you use strong anti-aliasing during conversion. I see no significant difference between end results.)- Image → Scale Image...
- Width and Height at 25%
- Cubic interpolation
- You can view at normal size if you want by pressing 1, Ctrl+E
- Save as Hilbert transform.png
Original version of this plot was made in GNU Octave with the command:
imag(hilbert(x))
Created by User:Omegatron using gnuplot, possibly with post-processing in the GIMP (PNG) or Inkscape (SVG)
- 您可以自由地:
- 共享 – 复制、发行并传播本作品
- 修改 – 改编作品
- 惟须遵守下列条件:
- 署名 – 您必须对作品进行署名,提供授权条款的链接,并说明是否对原始内容进行了更改。您可以用任何合理的方式来署名,但不得以任何方式表明许可人认可您或您的使用。
- 相同方式共享 – 如果您再混合、转换或者基于本作品进行创作,您必须以与原先许可协议相同或相兼容的许可协议分发您贡献的作品。

|
已授权您依据自由软件基金会发行的无固定段落及封面封底文字(Invariant Sections, Front-Cover Texts, and Back-Cover Texts)的GNU自由文件许可协议1.2版或任意后续版本的条款,复制、传播和/或修改本文件。该协议的副本请见“GNU Free Documentation License”。 |
(In short, this means that you can copy and modify the image freely as long as you provide attribution; preferably in the form of a link back to this page.)
文件历史
点击某个日期/时间查看对应时刻的文件。
| 日期/时间 | 缩略图 | 大小 | 用户 | 备注 | |
|---|---|---|---|---|---|
| 当前 | 2005年7月2日 (六) 18:54 | | 1,600 × 1,120(120 KB) | Omegatron(留言 | 贡献) | Image of the Hilbert transform of a square wave. |
| 2005年6月26日 (日) 19:53 |  | 608 × 433(5 KB) | Omegatron(留言 | 贡献) | A graph or diagram made by User:Omegatron. (Uploaded with Wikimedia Commons.) Source: Created by User:Omegatron {{GFDL}}{{cc-by-sa-2.0}} Category:Diagrams\ |
您不可以覆盖此文件。
文件用途
以下3个页面使用本文件:
全域文件用途
以下其他wiki使用此文件:
- ar.wikipedia.org上的用途
- ca.wikipedia.org上的用途
- es.wikipedia.org上的用途
- fa.wikipedia.org上的用途
- fr.wikipedia.org上的用途
- zh.wikipedia.org上的用途