File:Hong Kong Population.svg
ナビゲーションに移動
検索に移動

この SVG ファイルのこの PNG プレビューのサイズ: 750 × 450 ピクセル. その他の解像度: 320 × 192 ピクセル | 640 × 384 ピクセル | 1,024 × 614 ピクセル | 1,280 × 768 ピクセル | 2,560 × 1,536 ピクセル。
元のファイル (SVG ファイル、750 × 450 ピクセル、ファイルサイズ: 10キロバイト)
キャプション
キャプション
このファイルの内容を1行で記述してください
概要
[編集]
| 解説 |
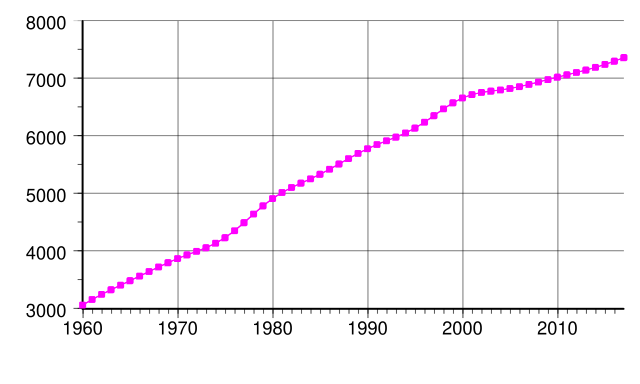
English: Graph showing the population of Hong Kong. Population in thousands. From UN estimates, World Population Prospects: The 2017 Revision |
| 日付 | (UTC) |
| 原典 | 投稿者自身による著作物 |
| 作者 | Wylve |
Generated with Wikimedia SVG Chart
[編集]
| Data format | The source data of the chart is in the SVG image file in a clearly readable format. You see the original numbers inside of the SVG file in the form of a list such as this:
... 1995 10.06 1996 11.75 1997 12.45 ... |
| Content of SVG | To view the data download the SVG file itself. To do so right-click this link, and then choose the option to save: File:Hong Kong Population.svg. Launch any text editor. Open the downloaded SVG file with the text editor (usually; file menu, open). To see the list of data, search for the phrase id="graph1". |
| Please, do not use a special SVG editor such as Inkscape; the readability of the database would be destroyed. You can edit the SVG file with any text editor, for example; en: List of text editors. You can view the edited SVG file in various web browsers. As of 2011, all major desktop browsers, and many minor ones, have some level of SVG support. See: en: Scalable Vector Graphics#Support for SVG in web browsers. When satisfied with your edits, upload the edited SVG file with the link labeled "Upload a new version of this file".
W3C-validity not checked. This chart was created with Wikimedia SVG Chart. このSVG統計図表は埋込み文を用いており,数字のみを用いています。 |
|
| Code to generate SVG | See: File talk:Hong Kong Population.svg. Documentation see: Wikimedia SVG Chart. |
ライセンス
[編集]
| この著作物の著作権者である私は、この著作物における権利を放棄しパブリックドメインとします。これは全世界で適用されます。 一部の国では、これが法的に可能ではない場合があります。その場合は、次のように宣言します。 私は、あらゆる人に対して、法により必要とされている条件を除き、如何なる条件も課すことなく、あらゆる目的のためにこの著作物を使用する権利を与えます。 |
ファイルの履歴
過去の版のファイルを表示するには、その版の日時をクリックしてください。
| 日付と時刻 | サムネイル | 寸法 | 利用者 | コメント | |
|---|---|---|---|---|---|
| 現在の版 | 2017年11月4日 (土) 22:56 | | 750 × 450 (10キロバイト) | Delphi234 (トーク | 投稿記録) | 2017 |
| 2017年11月4日 (土) 17:52 |  | 670 × 360 (5キロバイト) | Delphi234 (トーク | 投稿記録) | remove fill | |
| 2012年7月9日 (月) 12:37 |  | 670 × 360 (5キロバイト) | Wylve (トーク | 投稿記録) | workaround fill issue | |
| 2012年7月9日 (月) 12:06 |  | 670 × 360 (5キロバイト) | Wylve (トーク | 投稿記録) | fix fill | |
| 2012年7月9日 (月) 12:03 |  | 670 × 360 (5キロバイト) | Wylve (トーク | 投稿記録) | Add more data points and change graph type | |
| 2012年7月9日 (月) 09:00 |  | 670 × 360 (5キロバイト) | Wylve (トーク | 投稿記録) | == {{int:filedesc}} == {{Information |Description={{en|Graph showing the population of Hong Kong.}} |Source= |Date=2012-07-09 08:55 (UTC) |Author= |Permission= |other_versions= }} == {{int:license}} == {{self|PD-user-w}} Category:Demography |
このファイルは上書きできません。
ファイルの使用状況
以下のページがこのファイルを使用しています:
- File:Hong Kong Population Graph.svg (リダイレクト)
グローバルなファイル使用状況
以下に挙げる他のウィキがこの画像を使っています:
- de.wikipedia.org での使用状況
- en.wikipedia.org での使用状況
- ja.wikipedia.org での使用状況
- ko.wikipedia.org での使用状況
- ru.wikipedia.org での使用状況
- uk.wikipedia.org での使用状況
- vi.wikibooks.org での使用状況