File:India mumbai temperature precipitation averages chart.svg
跳转到导航
跳转到搜索

此SVG文件的PNG预览的大小:800 × 562像素。 其他分辨率:320 × 225像素 | 640 × 450像素 | 1,024 × 719像素 | 1,280 × 899像素 | 2,560 × 1,798像素。
原始文件 (SVG文件,尺寸为800 × 562像素,文件大小:50 KB)
说明
说明
添加一行文字以描述该文件所表现的内容
摘要
[编辑]
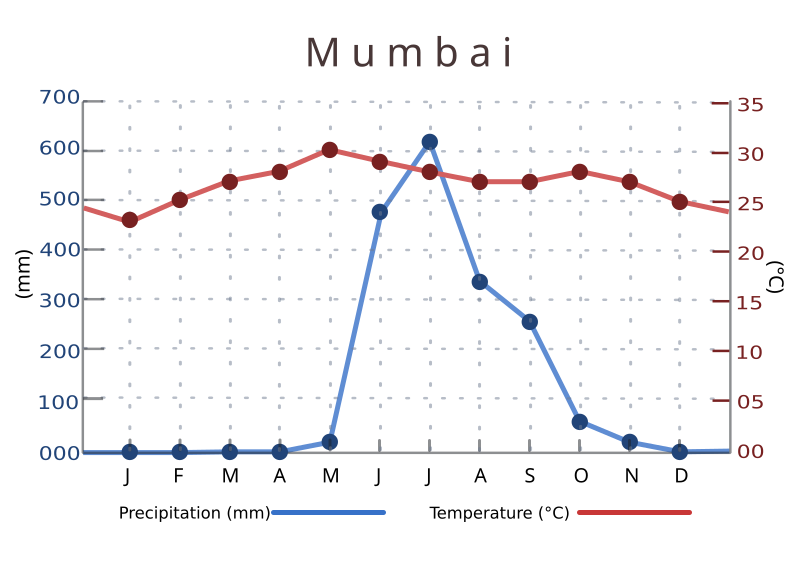
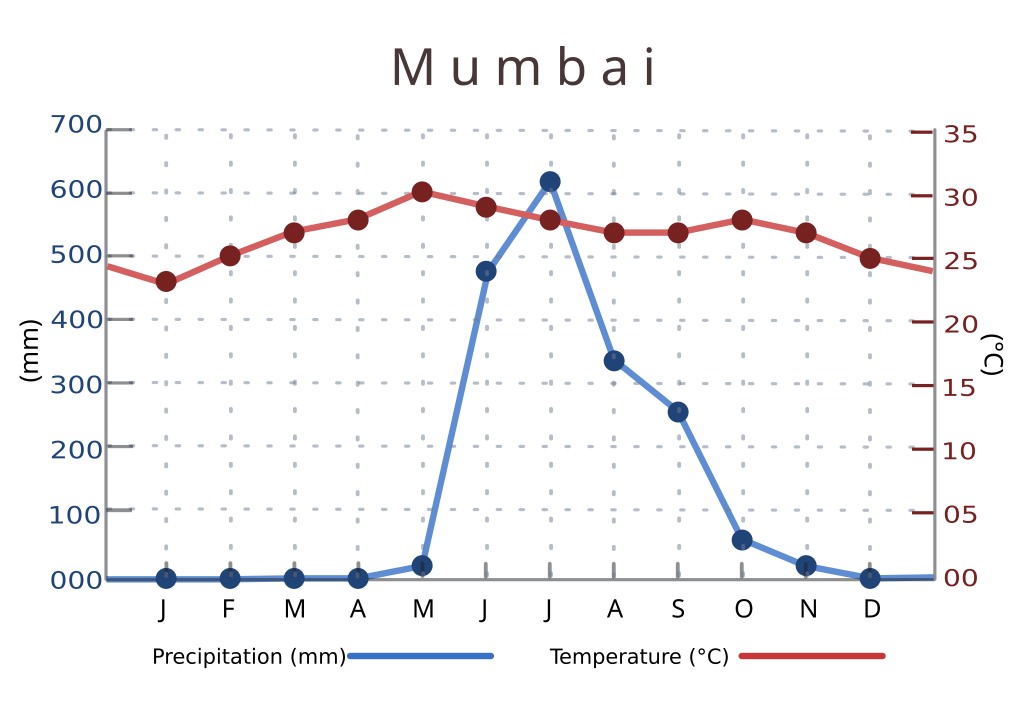
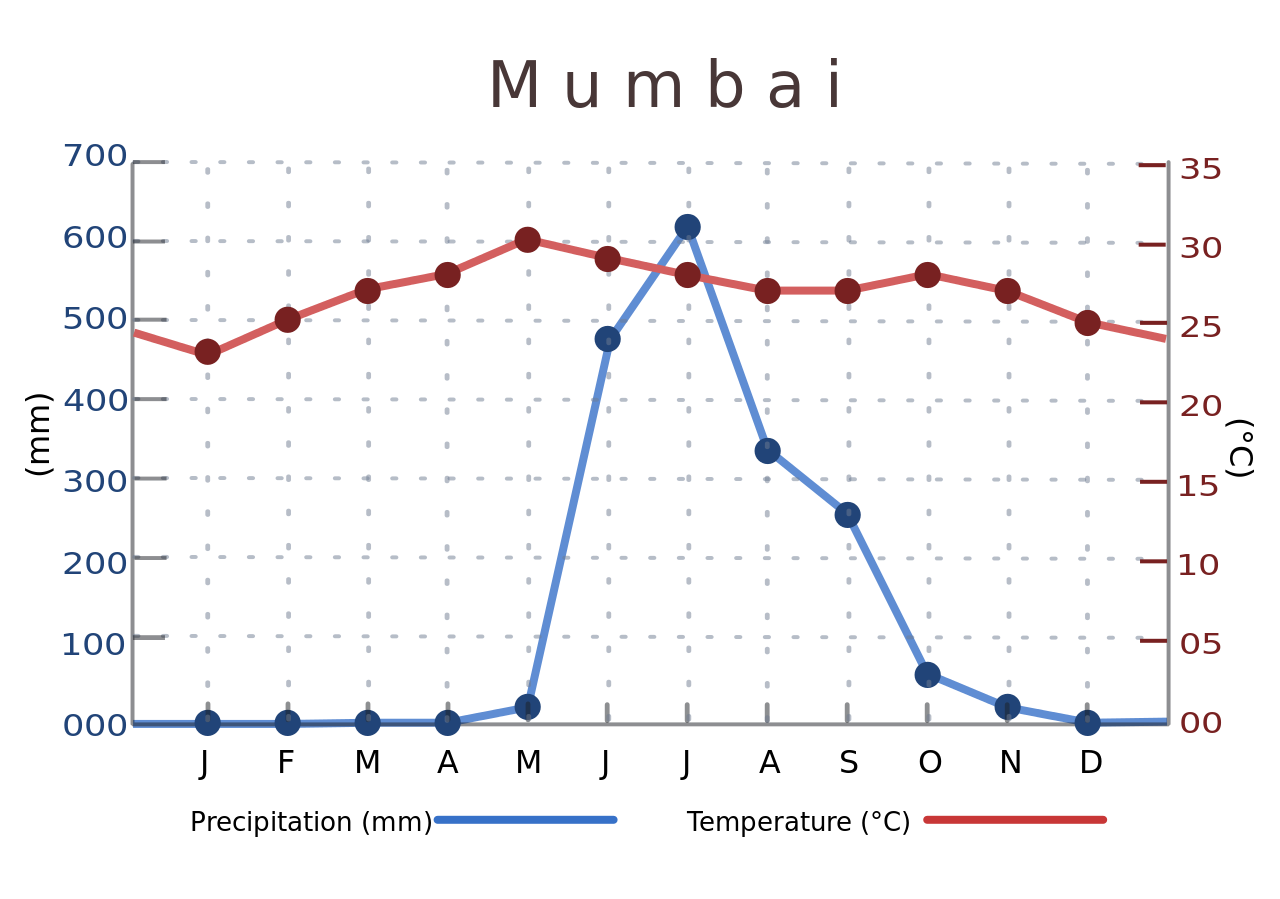
| 描述 | Chart showing historical averages of monthly precipitation and temperature in Mumbai, India |
| 日期 | |
| 来源 | Graph: own work. Data: [1][2][3][4] |
| 作者 | Saravask |
| SVG开发 |
References
[编辑]
- ↑ Country Guide: India. BBC Weather. Retrieved on 2007-03-23.
- ↑ Weatherbase. Weatherbase. Retrieved on 2007-03-24.
- ↑ Wunderground. Weather Underground. Retrieved on 2007-03-24.
- ↑ Weather.com. The Weather Channel. Retrieved on 2007-03-23.
许可协议
[编辑]
我,本作品著作权人,特此采用以下许可协议发表本作品:

|
已授权您依据自由软件基金会发行的无固定段落及封面封底文字(Invariant Sections, Front-Cover Texts, and Back-Cover Texts)的GNU自由文件许可协议1.2版或任意后续版本的条款,复制、传播和/或修改本文件。该协议的副本请见“GNU Free Documentation License”。 |
| 本文件采用知识共享署名-相同方式共享 3.0 未本地化版本许可协议授权。 | ||
| ||
| 本许可协议标签作为GFDL许可协议更新的组成部分被添加至本文件。 |
- 您可以自由地:
- 共享 – 复制、发行并传播本作品
- 修改 – 改编作品
- 惟须遵守下列条件:
- 署名 – 您必须对作品进行署名,提供授权条款的链接,并说明是否对原始内容进行了更改。您可以用任何合理的方式来署名,但不得以任何方式表明许可人认可您或您的使用。
- 相同方式共享 – 如果您再混合、转换或者基于本作品进行创作,您必须以与原先许可协议相同或相兼容的许可协议分发您贡献的作品。
您可以选择您需要的许可协议。
文件历史
点击某个日期/时间查看对应时刻的文件。
| 日期/时间 | 缩略图 | 大小 | 用户 | 备注 | |
|---|---|---|---|---|---|
| 当前 | 2007年4月1日 (日) 19:38 | | 800 × 562(50 KB) | Saravask(留言 | 贡献) | {{Information |Description=Chart showing historical averages of monthly precipitation and temperature in Mumbai, India |Source=Own work |Date=March 2007 |Author=Own work |Permission=See below |other_versions=None }} == Licensing == {{self|GFDL|cc-by-sa-2 |
| 2007年4月1日 (日) 15:18 |  | 800 × 562(50 KB) | Saravask(留言 | 贡献) | {{Information |Description=Chart showing historical averages of monthly precipitation and temperature in Mumbai, India |Source=Own work |Date=March 2007 |Author=Own work |Permission=See below |other_versions=None }} == Licensing == {{self|GFDL|cc-by-sa-2 | |
| 2007年4月1日 (日) 15:16 |  | 800 × 562(51 KB) | Saravask(留言 | 贡献) | == Summary == == Summary == {{Information |Description=Chart showing historical averages of monthly precipitation and temperature in Mumbai, India |Source=Own work |Date=March 2007 |Author=Own work |Permission=See below |other_versions=None }} == Licensi | |
| 2007年3月27日 (二) 03:45 |  | 800 × 562(52 KB) | Saravask(留言 | 贡献) | == Summary == {{Information |Description=Chart showing historical averages of monthly precipitation and temperature in Mumbai, India |Source=Own work |Date=March 2007 |Author=Own work |Permission=See below |other_versions=None }} |
您不可以覆盖此文件。
文件用途
没有页面使用本文件。
全域文件用途
以下其他wiki使用此文件:
- anp.wikipedia.org上的用途
- as.wikipedia.org上的用途
- bn.wikipedia.org上的用途
- el.wikipedia.org上的用途
- en.wikipedia.org上的用途
- eo.wikipedia.org上的用途
- eu.wikipedia.org上的用途
- gu.wikipedia.org上的用途
- hi.wikipedia.org上的用途
- hu.wikipedia.org上的用途
- id.wikipedia.org上的用途
- it.wikipedia.org上的用途
- mr.wikipedia.org上的用途
- ms.wikipedia.org上的用途
- or.wikipedia.org上的用途
- roa-tara.wikipedia.org上的用途
- sh.wikipedia.org上的用途
- sr.wikipedia.org上的用途
- ta.wikipedia.org上的用途
- tr.wikipedia.org上的用途
- zh.wikipedia.org上的用途