File:Instrumental Temperature Record (NASA).svg
跳转到导航
跳转到搜索

此SVG文件的PNG预览的大小:800 × 600像素。 其他分辨率:320 × 240像素 | 640 × 480像素 | 1,024 × 768像素 | 1,280 × 960像素 | 2,560 × 1,920像素 | 2,048 × 1,536像素。
原始文件 (SVG文件,尺寸为2,048 × 1,536像素,文件大小:29 KB)
说明
说明
添加一行文字以描述该文件所表现的内容
摘要
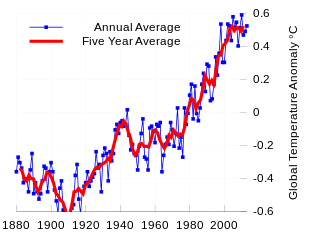
[编辑]| 描述 | This image shows the instrumental record of global average temperatures as compiled by the NASA's Goddard Institute for Space Studies. The data set used follows the methodology outlined by Hansen, J., et al. (2006) "Global temperature change". Proc. Natl. Acad. Sci. 103: 14288-14293. Following the common practice of the IPCC, the zero on this figure is the mean temperature from 1961-1990. The graph shows an overall long-term warming trend. In the 1880s, the global temperature anomaly was on average slightly below -0.4 °C, while in the first decade of the 21st century, the anomaly was on average almost +0.5 °C. This figure was originally prepared by Robert A. Rohde from publicly available data and is incorporated into the Global Warming Art project. | |||
| 日期 | ||||
| 来源 | 基于如下对象的个人作品: Instrumental Temperature Record.png | |||
| 作者 |
|
|||
| 其他版本 |
Derivative works of this file: Instrumental Temperature Record (NASA) mr.svg Instrumental Temperature Record.svg (UK data set) |
|||
| SVG开发 | ||||
| 原始码 | Gnuplot codeset term svg size 2048,1536 fsize 60
set output "temp.svg"
set border 1
set xtics nomirror
set ytics nomirror
set grid y2 lc rgb "#C0C0C0"
set grid x lc rgb "#C0C0C0"
unset xlabel
set y2label "Global Temperature Anomaly °C"
set key reverse top left #at 1970,0.4 Left
set y2tics 0.2
unset ytics
offset=0.07
plot [1880:2010] [-0.49:0.6] \
"Fig.A2.txt" \
using 1:($2-offset) \
title "Annual Average" \
lc rgb "blue" \
lw 5 \
pt 5 \
ps 0.5 \
with linespoints, \
"" \
using 1:($3-offset) \
title "Five Year Average" \
smooth csplines \
lc rgb "red" \
lw 20 \
with lines
|


.svg&action=edit§ion=1)
_mr.svg)
我,本作品著作权人,特此采用以下许可协议发表本作品:
| 本文件采用知识共享署名-相同方式共享 3.0 未本地化版本许可协议授权。 | ||
| ||
| 本许可协议标签作为GFDL许可协议更新的组成部分被添加至本文件。 |

|
已授权您依据自由软件基金会发行的无固定段落及封面封底文字(Invariant Sections, Front-Cover Texts, and Back-Cover Texts)的GNU自由文件许可协议1.2版或任意后续版本的条款,复制、传播和/或修改本文件。该协议的副本请见“GNU Free Documentation License”。 |
您可以选择您需要的许可协议。
原始上传日志
[编辑].svg&action=edit§ion=2)
This image is a derivative work of the following images:
- Instrumental Temperature Record.png licensed with Cc-by-sa-3.0-migrated, GFDL, GWArt
- 2010-02-20T00:51:53Z Dragons flight 1000x779 (44548 Bytes) update to 2009
- 2009-02-04T03:54:51Z Dragons flight 800x591 (40211 Bytes) update to 2008, change to GISS data
- 2008-02-21T07:48:45Z Dragons flight 800x593 (42215 Bytes) update to 2007
- 2005-09-02T22:01:16Z Wisty 525x390 (43395 Bytes) Global warming picture from wikipedia
hi!!! Uploaded with derivativeFX
文件历史
点击某个日期/时间查看对应时刻的文件。
.svg&uselang=zh-my&dir=prev)
.svg&uselang=zh-my&offset=20100620153018)
.svg&uselang=zh-my&offset=&limit=20)
.svg&uselang=zh-my&offset=&limit=50)
.svg&uselang=zh-my&offset=&limit=100)
.svg&uselang=zh-my&offset=&limit=250)
.svg&uselang=zh-my&offset=&limit=500)
| 日期/时间 | 缩略图 | 大小 | 用户 | 备注 | |
|---|---|---|---|---|---|
| 当前 | 2023年9月16日 (六) 09:24 | | 2,048 × 1,536(29 KB) | Jaumellecha(留言 | 贡献) | File uploaded using svgtranslate tool (https://svgtranslate.toolforge.org/). Added translation for ca. |
| 2014年2月26日 (三) 15:26 |  | 2,048 × 1,536(28 KB) | Kopiersperre(留言 | 贡献) | update 2013 | |
| 2011年6月5日 (日) 17:30 |  | 2,048 × 1,536(27 KB) | Alquery(留言 | 贡献) | Added 2010 data | |
| 2010年7月13日 (二) 01:15 |  | 2,048 × 1,536(28 KB) | Autopilot(留言 | 贡献) | Tweak font and line sizes | |
| 2010年7月13日 (二) 01:13 |  | 2,048 × 1,536(27 KB) | Autopilot(留言 | 贡献) | Moved y axis to right side to match up with carbon output graph | |
| 2010年6月20日 (日) 21:32 |  | 440 × 320(27 KB) | Autopilot(留言 | 贡献) | More tweaks, reducing weight of zero axis. | |
| 2010年6月20日 (日) 21:30 |  | 440 × 320(26 KB) | Autopilot(留言 | 贡献) | Moved title inside graph and made grid less strong. | |
| 2010年6月20日 (日) 21:01 |  | 440 × 320(26 KB) | Autopilot(留言 | 贡献) | Target size as a multiple of 220 since mediawiki resize doesn't seem to do antialiasing. | |
| 2010年6月20日 (日) 20:55 |  | 480 × 320(26 KB) | Autopilot(留言 | 贡献) | Updated based on comments on en:Talk:Global warming | |
| 2010年6月20日 (日) 15:30 |  | 1,024 × 768(24 KB) | Autopilot(留言 | 贡献) | Correct dataset so that 1961 == 0 as described in text. |
您不可以覆盖此文件。
文件用途
以下4个页面使用本文件:
全域文件用途
以下其他wiki使用此文件:
- ar.wikipedia.org上的用途
- ca.wikipedia.org上的用途
- en.wikipedia.org上的用途
- en.wikibooks.org上的用途
- es.wikipedia.org上的用途
- fa.wikipedia.org上的用途
- incubator.wikimedia.org上的用途
- ml.wikipedia.org上的用途
- th.wikipedia.org上的用途
- tr.wikipedia.org上的用途
- vi.wikipedia.org上的用途
.svg&oldid=802095306)