File:Land vs Ocean Temperature.svg
跳转到导航
跳转到搜索

此SVG文件的PNG预览的大小:800 × 579像素。 其他分辨率:320 × 232像素 | 640 × 463像素 | 1,024 × 741像素 | 1,280 × 927像素 | 2,560 × 1,853像素 | 960 × 695像素。
原始文件 (SVG文件,尺寸为960 × 695像素,文件大小:18 KB)
说明
说明
添加一行文字以描述该文件所表现的内容
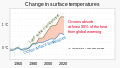
Land surface temperatures have increased faster than ocean temperatures as the ocean absorbs at least 90% of excess heat in the atmosphere.
摘要
[编辑]| 描述 |
English: Chart with data from NASA showing how land and sea surface air temperatures have changed up through 2022 relative to the 1951-1980 average. The ocean is absorbing over 90% of excess heat trapped in the atmosphere, greatly limiting global temperature change but contributing to sea level rise, coral bleaching, and other adverse effects.
Link to NASA GISS data access page and direct link to chart data, before being adjusted to be against IPCC baseline temp instead of mid century average. |
| 日期 | |
| 来源 | 自己的作品 |
| 作者 | Efbrazil |
| 其他版本 |
|


Related file(s)
[编辑]-
 20230706 Excess heat absorbed through ocean's surface - global warming.svg

许可协议
[编辑]
我,本作品著作权人,特此采用以下许可协议发表本作品:
本文件采用知识共享署名-相同方式共享 4.0 国际许可协议授权。
- 您可以自由地:
- 共享 – 复制、发行并传播本作品
- 修改 – 改编作品
- 惟须遵守下列条件:
- 署名 – 您必须对作品进行署名,提供授权条款的链接,并说明是否对原始内容进行了更改。您可以用任何合理的方式来署名,但不得以任何方式表明许可人认可您或您的使用。
- 相同方式共享 – 如果您再混合、转换或者基于本作品进行创作,您必须以与原先许可协议相同或相兼容的许可协议分发您贡献的作品。
文件历史
点击某个日期/时间查看对应时刻的文件。
| 日期/时间 | 缩略图 | 大小 | 用户 | 备注 | |
|---|---|---|---|---|---|
| 当前 | 2023年7月3日 (一) 23:24 | | 960 × 695(18 KB) | Efbrazil(留言 | 贡献) | Updated for data up through 2022, and culled data older than 1950 (suspect accuracy, irrelevant to baseline) |
| 2021年2月22日 (一) 18:07 |  | 960 × 685(20 KB) | Efbrazil(留言 | 贡献) | change vs --> change from | |
| 2021年1月17日 (日) 13:43 |  | 960 × 685(20 KB) | Efbrazil(留言 | 贡献) | Cropping / position fix to dates at bottom of chart | |
| 2021年1月17日 (日) 13:31 |  | 960 × 681(20 KB) | Efbrazil(留言 | 贡献) | Updated for 2020 data | |
| 2020年8月21日 (五) 21:35 |  | 960 × 681(21 KB) | Efbrazil(留言 | 贡献) | Fixed location of background, also fixed x axis tick marks to be standard | |
| 2020年8月1日 (六) 00:00 |  | 960 × 696(19 KB) | Efbrazil(留言 | 贡献) | Added fahrenheit to simplify for US audience | |
| 2020年5月13日 (三) 15:55 |  | 960 × 643(15 KB) | Nyq(留言 | 贡献) | Decapitalized common nouns | |
| 2020年4月3日 (五) 22:11 |  | 960 × 643(15 KB) | Efbrazil(留言 | 贡献) | Changing 92% to "over 90%" as per conflicting sources (some say over 93%). Also darkened up trace lines a bit. | |
| 2020年3月3日 (二) 22:19 |  | 960 × 643(15 KB) | Efbrazil(留言 | 贡献) | Improved title precision | |
| 2020年3月2日 (一) 21:14 |  | 960 × 643(15 KB) | Efbrazil(留言 | 贡献) | Fixing to better match the chart above this one. Also right aligned title text. |
您不可以覆盖此文件。
文件用途
以下5个页面使用本文件:
全域文件用途
以下其他wiki使用此文件:
- az.wikipedia.org上的用途
- bn.wikipedia.org上的用途
- cs.wikipedia.org上的用途
- en.wikipedia.org上的用途
- es.wikipedia.org上的用途
- ha.wikipedia.org上的用途
- he.wikipedia.org上的用途
- id.wikipedia.org上的用途
- it.wikipedia.org上的用途
- ko.wikipedia.org上的用途
- 해수의 온도
- 기후변화가 해양에 미치는 영향
- 사용자:이강철 (WMKR)/심사/기후변화 문서보강 프로젝트/Happyme1/기후변화가 해양에 미치는 영향/4월 19일
- 사용자:이강철 (WMKR)/심사/기후변화 문서보강 프로젝트/Happyme1/기후변화가 해양에 미치는 영향/4월 22일
- 사용자:이강철 (WMKR)/심사/기후변화 문서보강 프로젝트/Happyme1/기후변화가 해양에 미치는 영향/4월 24일
- 사용자:이강철 (WMKR)/심사/기후변화 문서보강 프로젝트/Happyme1/기후변화가 해양에 미치는 영향/4월 25일
- 사용자:이강철 (WMKR)/심사/기후변화 문서보강 프로젝트/Happyme1/기후변화가 해양에 미치는 영향/4월 28일
- ku.wikipedia.org上的用途
- mk.wikipedia.org上的用途
- uz.wikipedia.org上的用途
- www.wikidata.org上的用途
- zh.wikipedia.org上的用途