File:Late glacial temperature curve1.jpg
Alkuperäinen tiedosto (1 600 × 766 kuvapistettä, 344 KiB, MIME-tyyppi: image/jpeg)
Kuvatekstit
Kuvatekstit
Yhteenveto
[muokkaa]
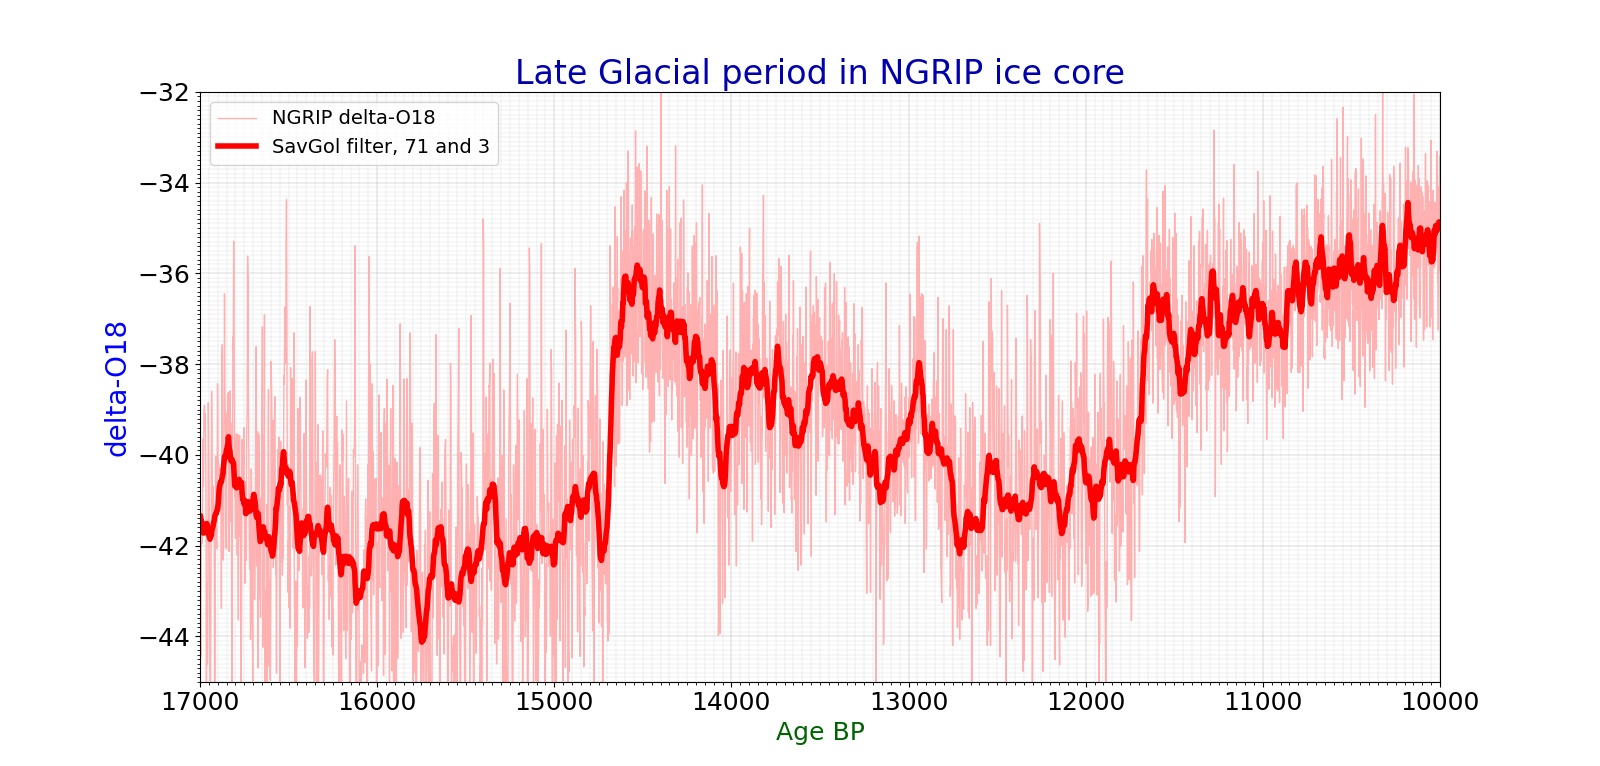
| Kuvaus | Temperature curve of late glacial period, from NGRIP greenland ice core oxygen isotope ratio. Numbers thousands of years ago, time goes from right to left, up is warmer, down is colder. The periot spans from Lascaux interstadial to Heinrich event H1, and to Meiendorf/Bölling warm stage, and Allegöd warm stage, to Younger dryas and early holocene. |
| Päiväys | 3. joulukuuta 2007 (tallennuspäivä) |
| Lähde | Oma teos |
| Tekijä | Merikanto |
Additional info
[muokkaa]
Source of data is
http://www.iceandclimate.nbi.ku.dk/data/ http://www.iceandclimate.nbi.ku.dk/data/NGRIP_d18O_and_dust_5cm.xls
δ18O values and dust concentrations
The dataset provides NGRIP δ18O
values, dust concentrations, and GICC05 ages in 5cm depth resolution for the
period 0-60 ka (δ18O) and 10-60 ka (dust).
The dataset accompany the following papers:
NGRIP members, Nature, 431, 147-151, 2004. DOI: 10.1038/nature02805
Gkinis et al., Earth Planet. Sci. Lett., 405, 132-141, 2014.  DOI:
10.1016/j.epsl.2014.08.022
Ruth et al., J. Geophys. Res., 108, 4098, 2003. DOI: 4010.1029/2002JD002376
Python code
- drawing climate diagram in python 3
- version 2.11
- 11.9.2020
-
import matplotlib.pyplot as plt
import numpy as np
import pandas as pd
from scipy import interpolate
from matplotlib.ticker import (MultipleLocator, AutoMinorLocator)
import scipy.signal
def running_mean(x, N):
   cumsum = np.cumsum(np.insert(x, 0, 0))
   return (cumsum[N:] - cumsum[:-N]) / float(N)
datafilename="ngrip1.csv"
captioni="Late Glacial period in NGRIP ice core"
savename="ngrip_dryas.svg"
figsizex=16
figsizey=8
- x = []
- y = []
- y2= []
dfin0=pd.read_csv(datafilename, sep=";")
lst1=['gicc05_age','delta_O18']
dfin1 = dfin0[dfin0.columns.intersection(lst1)]
x0=dfin1['gicc05_age']
y0=dfin1['delta_O18']
- y20=dfin1['GISP_dO18']
- y30=dfin1['GISP2_dO18']
x=np.array(x0)
y=np.array(y0)
- y2=np.array(y20)
- y3=np.array(y30)
- list1=[]
- list1.append(y)
- list1.append(y2)
- list1.append(y3)
- data1=np.array(list1)
- print (np.shape(data1))
- data_avg1=np.average(data1, axis=0)
- print(x)
- print(y)
- quit(0)
size0=14
size1=16
size2=18
size3=24
- y_savgol = scipy.signal.savgol_filter(y,31, 3)
y_savgol = scipy.signal.savgol_filter(y,71, 3)
- y_running = running_mean(y, 31)
x_sm = np.array(x)
y_sm = np.array(y)
x_smooth = np.linspace(x_sm.min(), x_sm.max(), 20000)
funk1 = interpolate.interp1d(x_sm, y_sm, kind="cubic")
y_smooth = funk1(x_smooth)


fig, ax1 = plt.subplots()
- ax1.axis((11600,14000,0,ymax1))
ax1.set_xlim(10000,17000)
ax1.set_ylim(-32.0, -45.0)
- ax1.set_ylim(-35.0, -42.0)
plt.gca().invert_xaxis()
plt.gca().invert_yaxis()
ax1.set_ylabel('delta-O18', color='#0000ff', fontsize=size2+2)


ax1.plot(x,y, color="#ffb0b0", linewidth=1,label="NGRIP delta-O18")
- ax1.plot(x_smooth,y_smooth, color="#0000ff", linewidth=3,label="NGRIP delta-O18")
ax1.plot(x,y_savgol, color="#FF0000", linewidth=4, label="SavGol filter, 71 and 3")
- ax1.plot(x,y_running, color="#FF0000", linewidth=3)
- ax1.plot(x,data_avg1, color="#ff0000", linewidth=2, linestyle=":", label="Average of NGRIP, GISP, GISP2 delta-O18")
ax1.tick_params(axis='both', which='major', labelsize=size2)
ax1.xaxis.set_minor_locator(MultipleLocator(500))
ax1.xaxis.set_minor_locator(MultipleLocator(50))
ax1.yaxis.set_minor_locator(MultipleLocator(1.0))
ax1.yaxis.set_minor_locator(MultipleLocator(0.1))
ax1.grid(which='major', linestyle='-', linewidth='0.1', color='black')
ax1.grid(which='minor', linestyle=':', linewidth='0.1', color='black')


ax1.set_xlabel('Age BP', color="darkgreen", fontsize=size2)


ax1.set_title(captioni, fontsize=size3, color="#0000af")
plt.legend(fontsize=size0)
fig = plt.gcf()
fig.set_size_inches(figsizex, figsizey, forward=True)


plt.savefig(savename, format="svg", dpi = 100)
plt.show()
Lisenssi
[muokkaa]
| Minä, tämän teoksen tekijänoikeudellinen omistaja, julkaisen tämän teoksen public domainiin eli luovun kaikista tekijänoikeuksista lain sallimissa puitteissa. Tämä on voimassa maailmanlaajuisesti. Joissain maissa laki ei mahdollista tätä. Mikäli näin on: Myönnän kenelle tahansa oikeuden käyttää tätä teosta mihin tahansa tarkoitukseen, ilman mitään ehtoja, ellei laki vaadi ehtojen asettamista. |
Tiedoston historia
Päiväystä napsauttamalla näet, millainen tiedosto oli kyseisellä hetkellä.
| Päiväys | Pienoiskuva | Koko | Käyttäjä | Kommentti | |
|---|---|---|---|---|---|
| nykyinen | 12. syyskuuta 2020 kello 17.25 | | 1 600 × 766 (344 KiB) | Merikanto (keskustelu | muokkaukset) | New data and layoyut |
| 3. joulukuuta 2007 kello 21.12 |  | 910 × 579 (135 KiB) | Merikanto~commonswiki (keskustelu | muokkaukset) | {{Information |Description=Temperature curve of late glacial period, from NGRIP greenland ice core oxygen isotope ratio. Numbers thousands of years ago, time goes from right to left, up is warmer, down is colder. The periot spans from Lascaux interstadial |
Et voi tallentaa uutta tiedostoa tämän tilalle.
Tiedoston käyttö
Tätä tiedostoa ei käytetä millään sivulla.
Tiedoston järjestelmänlaajuinen käyttö
Seuraavat muut wikit käyttävät tätä tiedostoa:
- Käyttö kohteessa en.wikiversity.org
- Käyttö kohteessa fi.wikipedia.org