File:Latitude Longitude Evaporation minus precipitation.jpg
跳至導覽
跳至搜尋

預覽大小:800 × 429 像素。 其他解析度:320 × 172 像素 | 809 × 434 像素。
原始檔案 (809 × 434 像素,檔案大小:136 KB,MIME 類型:image/jpeg)
說明
說明
添加單行說明來描述出檔案所代表的內容
摘要
[編輯]
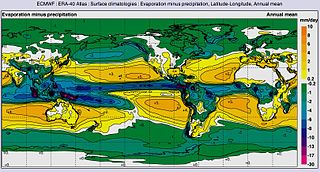
| 描述 | Global map of Annual mean Evaporation minus precipitation by Latitude-Longitude | |||||
| 日期 | ||||||
| 來源 | ERA-40 Atlas [1] [2] | |||||
| 作者 | NASA & European Centre for Medium-Range Weather Forecasts (ECMWF) | |||||
| 授權許可 (重用此檔案) |
|
授權條款
[編輯]
| 本作品由NASA創作,屬於公有領域。根據NASA的版權政策:“NASA的創作除非另有聲明否則不受版權保護。”(參見:Template:PD-USGov/zh,NASA版權政策或JPL圖像使用政策) | ||
 |
警告:
|
原始上傳日誌
[編輯]
The original description page was here. All following user names refer to en.wikipedia.
| 日期/時間 | 尺寸 | 用戶 | 備註 |
|---|---|---|---|
| 2014-01-28 17:19:25 | 809× 434× | LollyBear12 | {{Information |Description = Evaporation minus precipitation, Latitude-Longitude, Annual meanThis graph shows how the average surface temperature of the world's oceans has changed since 1880. This graph uses the 1971 to 2000 average as a baseline for... |
檔案歷史
點選日期/時間以檢視該時間的檔案版本。
| 日期/時間 | 縮圖 | 尺寸 | 用戶 | 備註 | |
|---|---|---|---|---|---|
| 目前 | 2016年11月5日 (六) 20:18 | | 809 × 434(136 KB) | Zppix(對話 | 貢獻) | Transferred from en.wikipedia (MTC!) |
無法覆蓋此檔案。
檔案用途
沒有使用此檔案的頁面。
全域檔案使用狀況
以下其他 wiki 使用了這個檔案:
- bg.wikipedia.org 的使用狀況
- ca.wikipedia.org 的使用狀況
- cs.wikipedia.org 的使用狀況
- cy.wikipedia.org 的使用狀況
- en.wikipedia.org 的使用狀況
- es.wikipedia.org 的使用狀況
- sr.wikipedia.org 的使用狀況
- tr.wikipedia.org 的使用狀況
- zh.wikipedia.org 的使用狀況