File:Linear-regression.svg
跳转到导航
跳转到搜索

此SVG文件的PNG预览的大小:600 × 480像素。 其他分辨率:300 × 240像素 | 960 × 768像素 | 1,280 × 1,024像素 | 2,560 × 2,048像素。
原始文件 (SVG文件,尺寸为600 × 480像素,文件大小:7 KB)
说明
说明
添加一行文字以描述该文件所表现的内容
摘要[编辑]
| 描述 |
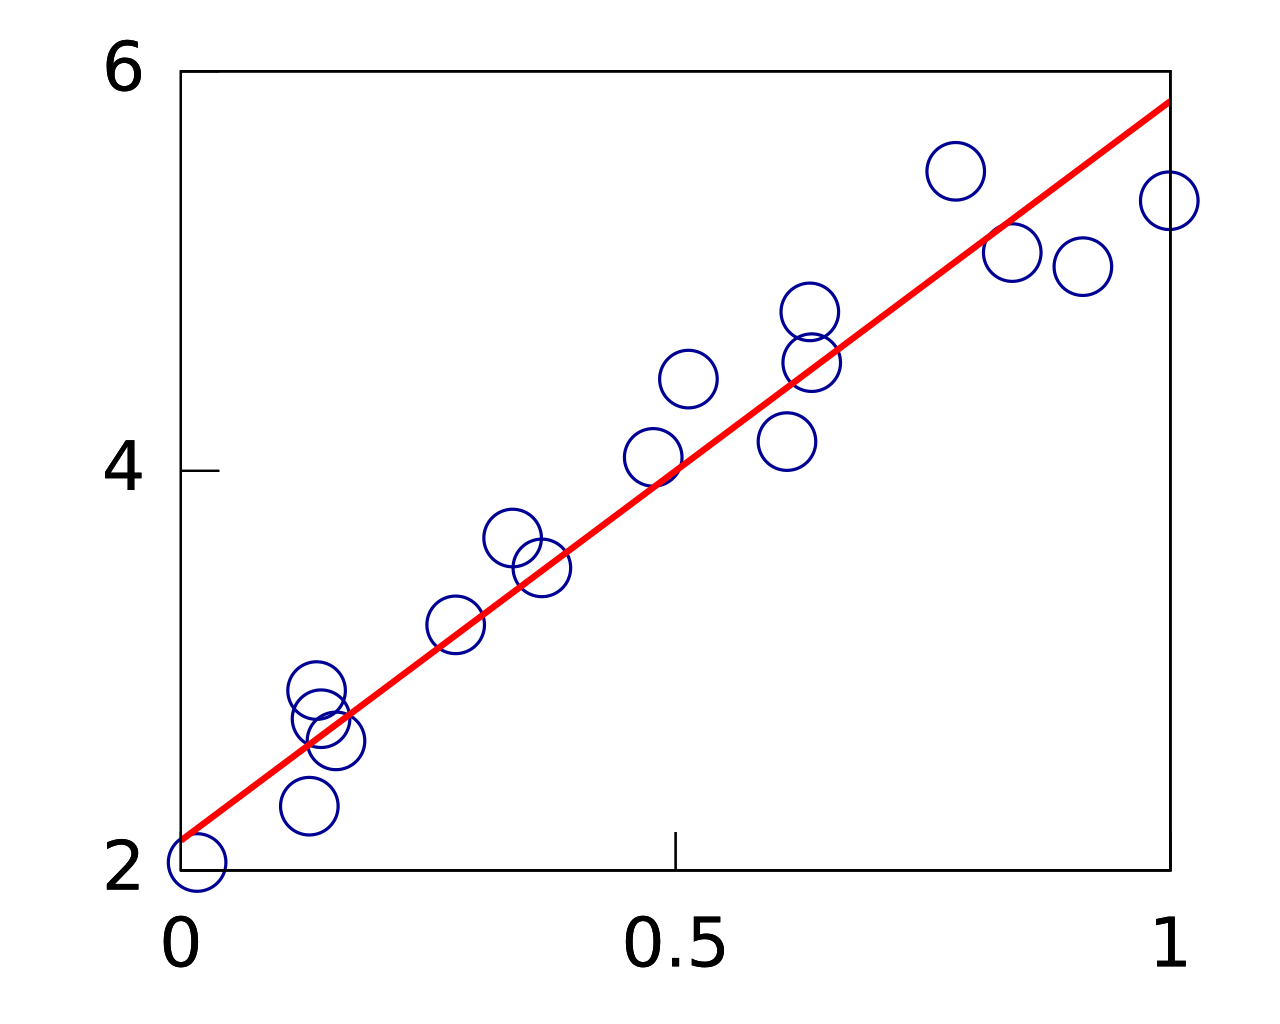
English: An example of linear regression |
| 日期 | |
| 来源 | 自己的作品 |
| 作者 | Qef |
| 其他版本 | Designed to replace original bitmap version: en:File:Linear-regression.png |
许可协议[编辑]
| 本作品已被作者Qef释出到公有领域。这适用于全世界。 在一些国家这可能不合法;如果是这样的话,那么: |
Gnuplot source[编辑]
Created with the following Gnuplot file:
set terminal svg font "Bitstream Vera Sans,24"
set output "Linear-regression.svg"

set xrange [0:1]
set yrange [2:6]
set xzeroaxis linetype -1
set yzeroaxis linetype -1
set xtics border nomirror 0.5
set ytics border nomirror 2
set key off
set border 15
set samples 2  # duh, straight line

plot '-' with points pointtype 6 pointsize 1.5 linecolor 6
0.84018771715471	5.0920721752254
0.78309922375861	5.4993770054934
0.91164735793678	5.0219594480046
0.33522275571489	3.663139781769
0.27777471080319	3.2292176040979
0.47739705186216	4.0677809238643
0.36478447279184	3.5137723092023
0.95222972517471	6.3816035819077
0.6357117279599	4.7956233221396
0.1416025553558	2.7597376235082
0.01630057162433	2.0398219692681
0.13723157678602	2.9002851883054
0.15667908925408	2.6485946288034
0.12979044678146	2.3215484331961
0.99892451800356	5.3518979261186
0.5129323944044	4.4596524827421
0.61263983259566	4.1465031113153
0.63755226770302	4.5417962600388
e
plot 3.7*x+2.15 with lines linewidth 3 linecolor 1
The actual data is just randomly choosen points along the line, randomly displaced from it, created with a small Lua program:
function f (x) return 3.7 * x + 2.15 end

for _ = 1, 18 do
    local x = math.random()
    print(x, f(x) * (0.85 + 0.3 * math.random()))
end
文件历史
点击某个日期/时间查看对应时刻的文件。
| 日期/时间 | 缩略图 | 大小 | 用户 | 备注 | |
|---|---|---|---|---|---|
| 当前 | 2009年6月21日 (日) 05:19 | | 600 × 480(7 KB) | Qef(留言 | 贡献) | {{Information |Description={{en|1=An example of linear regression}} |Source=Own work by uploader |Author=Qef |Date=2009-06-21 |Permission= |other_versions=Designed to replace original bitmap version: en:File:Linear-regression.png }} <!- |
您不可以覆盖此文件。
文件用途
没有页面使用本文件。
全域文件用途
以下其他wiki使用此文件:
- bs.wikipedia.org上的用途
- ca.wikipedia.org上的用途
- el.wikipedia.org上的用途
- en.wikipedia.org上的用途
- hy.wikipedia.org上的用途
- mk.wikipedia.org上的用途
- sh.wikipedia.org上的用途
- sq.wikipedia.org上的用途
- sr.wikipedia.org上的用途
- ta.wikipedia.org上的用途
- tl.wikipedia.org上的用途
- tum.wikipedia.org上的用途
- uk.wikipedia.org上的用途
- zh.wikipedia.org上的用途