File:Newton iteration.png
Spring til navigation
Spring til søgning
Størrelse af denne forhåndsvisning: 729 × 599 pixels. Andre opløsninger: 292 × 240 pixels | 584 × 480 pixels | 934 × 768 pixels | 1.246 × 1.024 pixels | 2.406 × 1.978 pixels.
Oprindelig fil (2.406 × 1.978 billedpunkter, filstørrelse: 55 KB, MIME-type: image/png)
Captions
Captions
Tilføj en kort forklaring på en enkelt linje om hvad filen viser
Beskrivelse[redigér]

|
En vektorversion af dette billede (SVG) er tilgængelig. Det bør bruges i stedet for punktgrafikbilledet når det er fordelagtigt.
File:Newton iteration.png → File:Newton iteration.svg
For mere information om vektorgrafik: Læs om overgangen til SVG på Commons. Se også information om MediaWikis understøttelse af SVG-billeder. |
 |
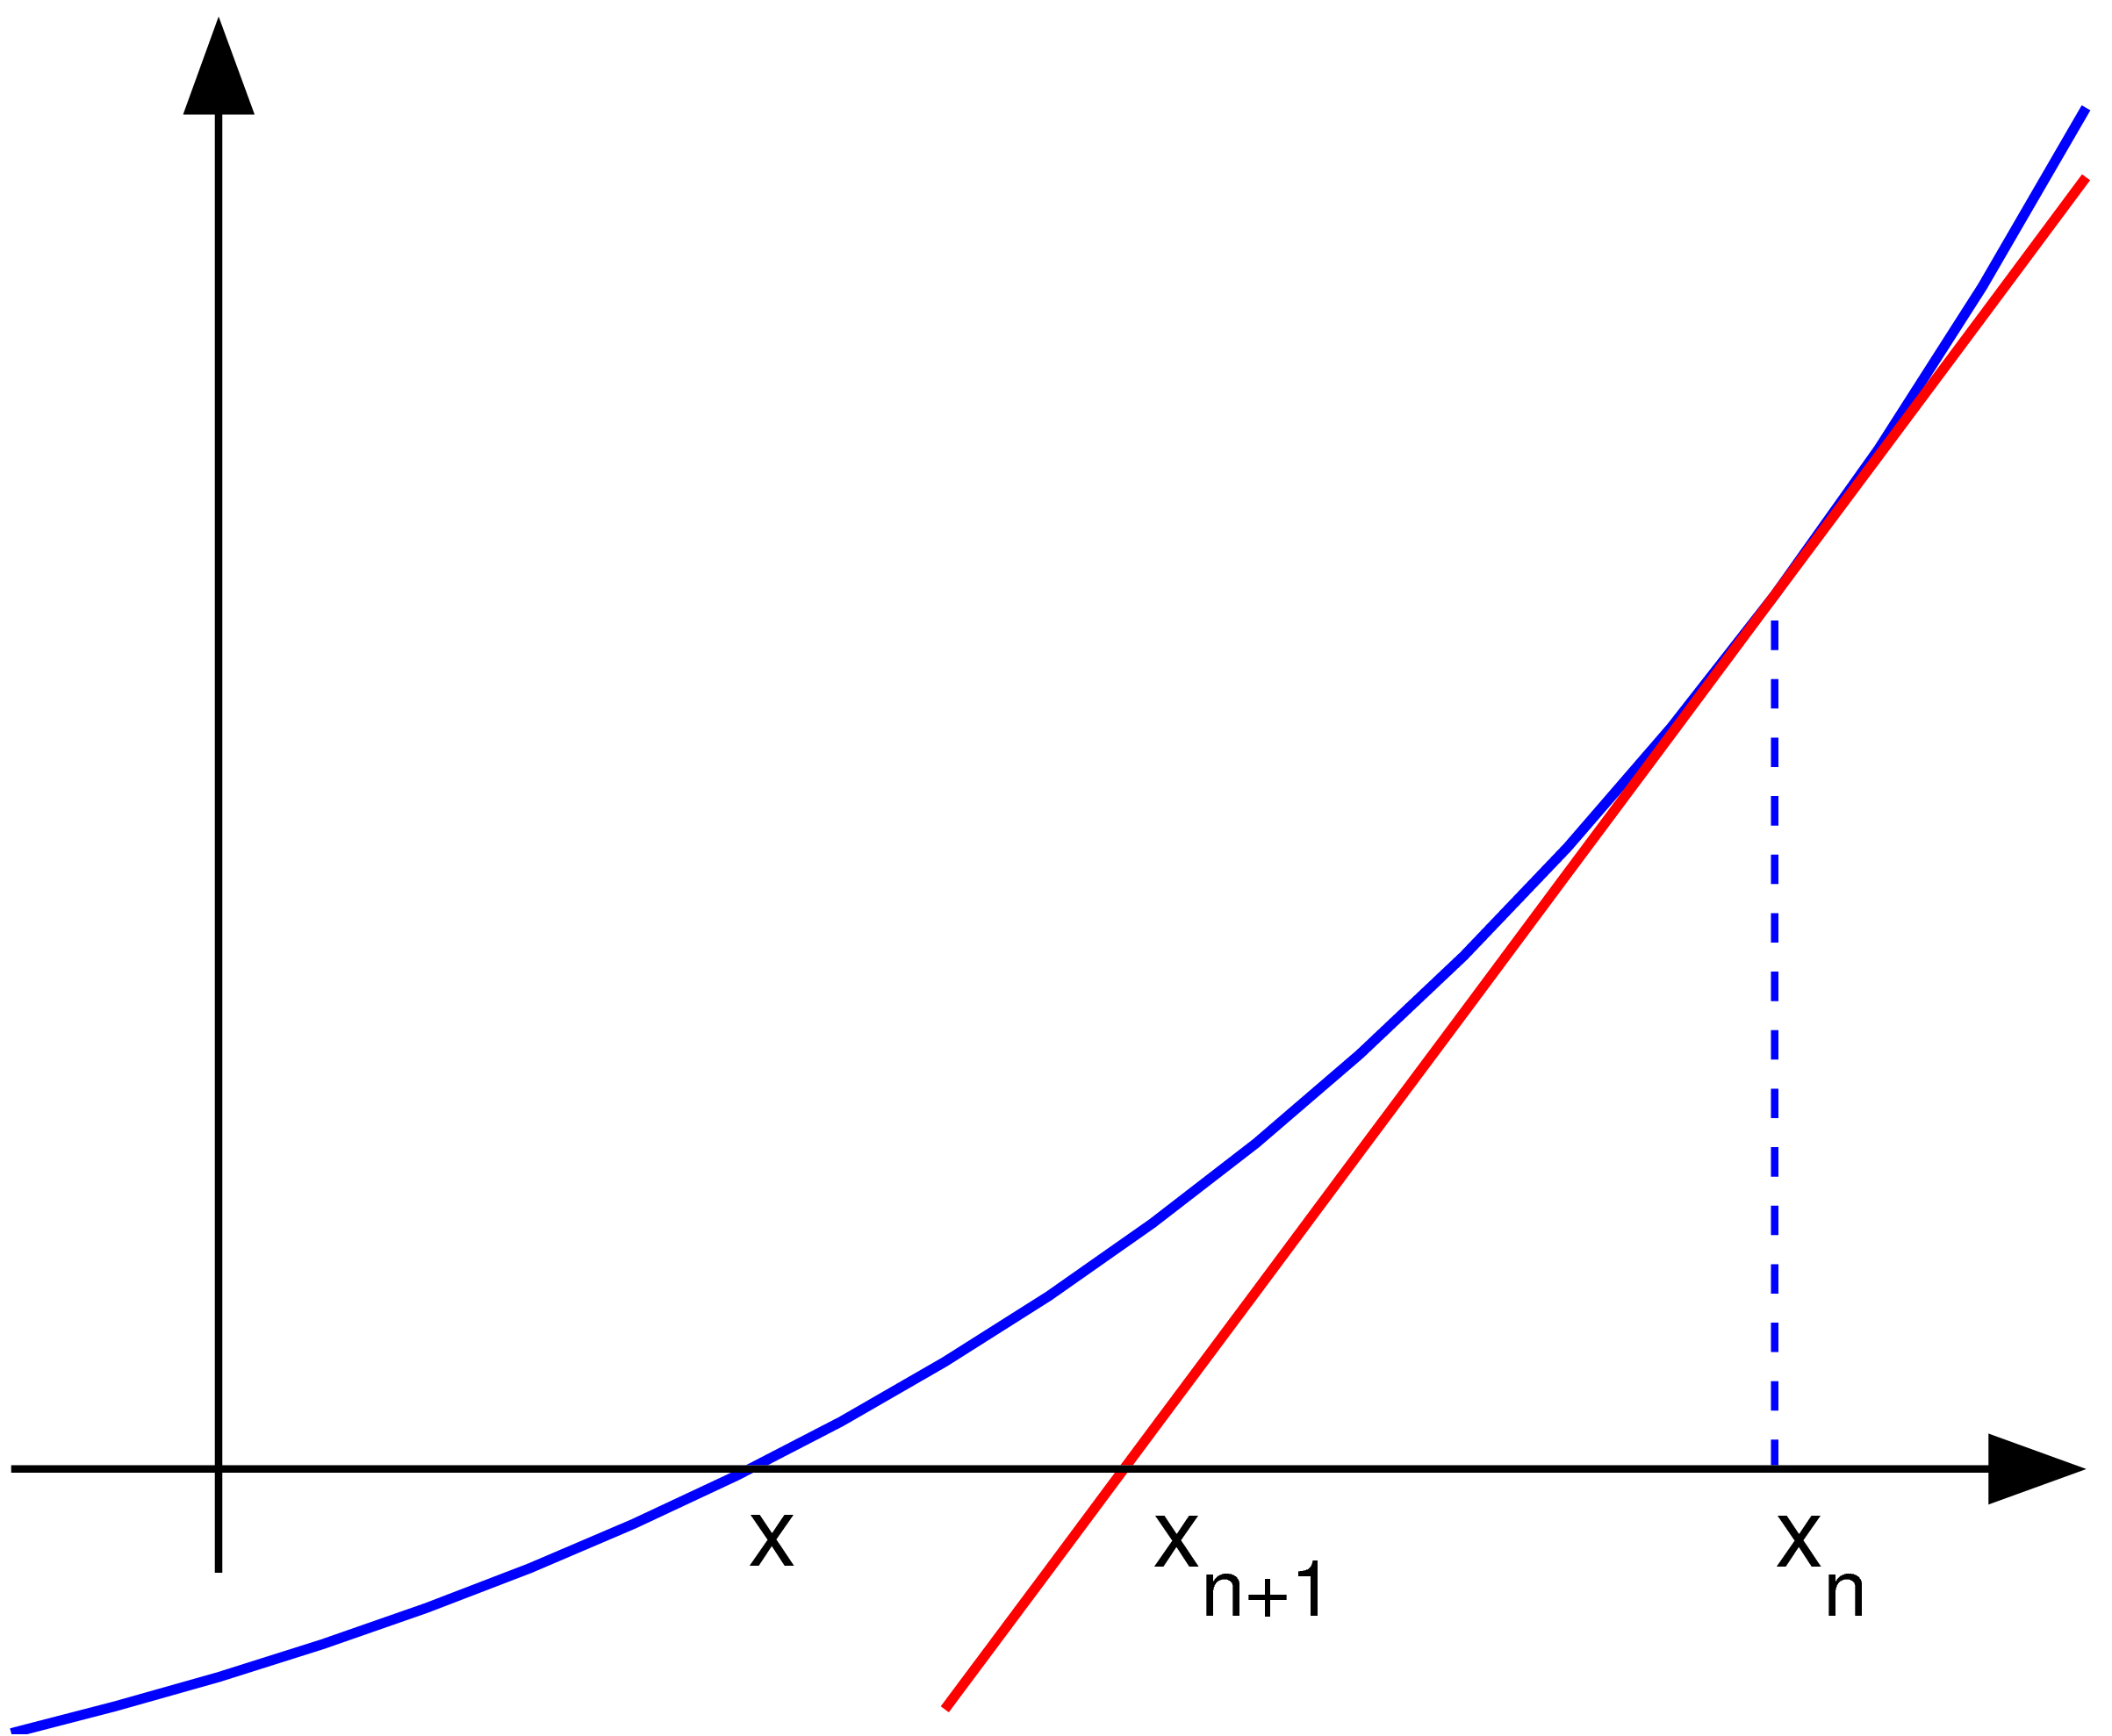
| Beskrivelse | Uploader graphed this with en:MATLAB (Illustration of en:Newton's method) | ||
| Dato | 22. november 2004 (first version); 2004-11-23 (last version) | ||
| Kilde | Transferred from en.wikipedia to Commons. | ||
| Forfatter | Olegalexandrov at engelsk Wikipedia | ||
| PNG udvikling | PNG Rastergrafik blev lavet med MATLAB. | ||
| Kildekode | MATLAB code
|
Licensering[redigér]
| Dette værk er blevet udgivet som offentlig ejendom af dets skaber, Olegalexandrov at engelsk Wikipedia. Dette gælder i hele verden. I nogle lande er dette ikke juridisk muligt. I så fald: Olegalexandrov giver enhver ret til at anvende dette værk til ethvert formål, uden nogen restriktioner, medmindre sådanne restriktioner er påkrævede ved lov. |
Oprindelig oplægningslog[redigér]
The original description page was here. All following user names refer to en.wikipedia.
- 2004-11-23 19:55 Olegalexandrov 405×340×8 (14290 bytes) Scaled down the picture of Newton's method
- 2004-11-22 21:34 Olegalexandrov 509×406×8 (16510 bytes) I graphed this with Matlab (Illustration of Newton's method) {{PD}}
Filhistorik
Klik på en dato/tid for at se filen som den så ud på det tidspunkt.
| Dato/tid | Miniaturebillede | Dimensioner | Bruger | Kommentar | |
|---|---|---|---|---|---|
| nuværende | 25. maj 2007, 03:23 | | 2.406 × 1.978 (55 KB) | Oleg Alexandrov (diskussion | bidrag) | {{Information |Description=Uploader graphed this with en:MATLAB (Illustration of en:Newton's method) ==Source code== <pre> <nowiki> % illustration of Newton's method for finding a zero of a function function main () a=-1; b=1; % interva |
| 12. jun. 2005, 23:11 |  | 405 × 340 (6 KB) | Everlong (diskussion | bidrag) | optimized for smaller file size | |
| 17. jan. 2005, 23:06 |  | 405 × 340 (14 KB) | Andreas Ipp~commonswiki (diskussion | bidrag) | {{PD}}: Original author graphed this with MATLAB (Illustration of Newton's method), from Wikipedia. |
Du kan ikke overskrive denne fil.
Filanvendelse
Der er ingen sider der bruger denne fil.
Global filanvendelse
Følgende andre wikier anvender denne fil:
- Anvendelser på en.wikipedia.org
- Anvendelser på fa.wikipedia.org
- Anvendelser på fr.wikipedia.org