File:North Atlantic Tropical Cyclone Activity 1949–2015 Power Dissipation Index PDI NOAA EPA.png
跳转到导航
跳转到搜索

本预览的尺寸:800 × 500像素。 其他分辨率:320 × 200像素 | 640 × 400像素 | 928 × 580像素。
原始文件 (928 × 580像素,文件大小:65 KB,MIME类型:image/png)
说明
说明
添加一行文字以描述该文件所表现的内容
摘要
[编辑]
| 描述 |
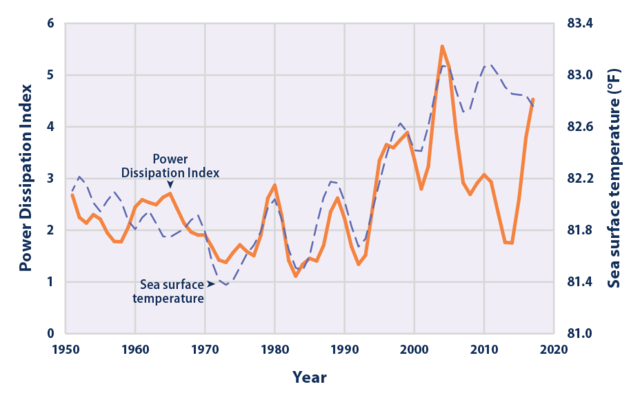
English: North Atlantic Tropical Cyclone Activity According to the Power Dissipation Index, 1949–2015
This figure presents annual values of the Power Dissipation Index (PDI), which accounts for cyclone strength, duration, and frequency. Tropical North Atlantic sea surface temperature trends are provided for reference. Note that sea surface temperature is measured in different units, but the values have been plotted alongside the PDI to show how they compare. The lines have been smoothed using a five-year weighted average, plotted at the middle year. The most recent average (2011–2015) is plotted at 2013. Data source: Emanuel, K.A. 2016 update to data originally published in: Emanuel, K.A. 2007. Environmental factors affecting tropical cyclone power dissipation. J. Climate 20(22):5497–5509. |
| 日期 | |
| 来源 | https://www.epa.gov/climate-indicators/climate-change-indicators-tropical-cyclone-activity#6 |
| 作者 | EPA/NOAA |
许可协议
[编辑]
本图像属于公有领域,因该作品最初来自于美国国家海洋和大气管理局职员的职务作品。
|
文件历史
点击某个日期/时间查看对应时刻的文件。
| 日期/时间 | 缩略图 | 大小 | 用户 | 备注 | |
|---|---|---|---|---|---|
| 当前 | 2022年9月2日 (五) 11:43 | | 928 × 580(65 KB) | Adakiko(留言 | 贡献) | Current power disipation plotted to 2017 |
| 2022年9月2日 (五) 11:35 |  | 928 × 580(83 KB) | Adakiko(留言 | 贡献) | Current 1880 to 2021 | |
| 2017年10月8日 (日) 14:51 |  | 928 × 580(67 KB) | Prokaryotes(留言 | 贡献) | User created page with UploadWizard |
您不可以覆盖此文件。
文件用途
没有页面使用本文件。
全域文件用途
以下其他wiki使用此文件:
- bn.wikipedia.org上的用途
- en.wikipedia.org上的用途
- ko.wikipedia.org上的用途
- zh.wikipedia.org上的用途