File:North Atlantic Tropical Cyclone Activity 1949–2015 Power Dissipation Index PDI NOAA EPA.png
跳至導覽
跳至搜尋

預覽大小:800 × 500 像素。 其他解析度:320 × 200 像素 | 640 × 400 像素 | 928 × 580 像素。
原始檔案 (928 × 580 像素,檔案大小:65 KB,MIME 類型:image/png)
說明
說明
添加單行說明來描述出檔案所代表的內容
摘要
[編輯]
| 描述 |
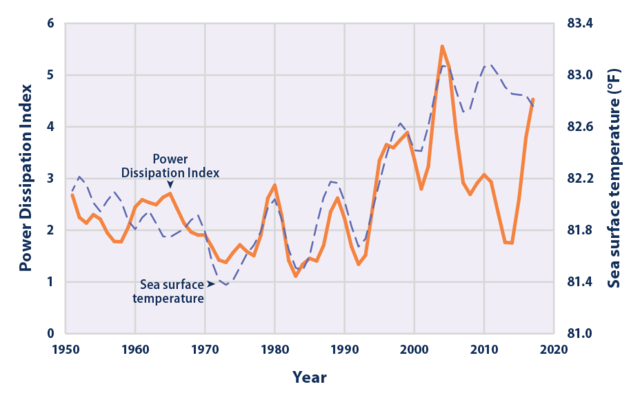
English: North Atlantic Tropical Cyclone Activity According to the Power Dissipation Index, 1949–2015
This figure presents annual values of the Power Dissipation Index (PDI), which accounts for cyclone strength, duration, and frequency. Tropical North Atlantic sea surface temperature trends are provided for reference. Note that sea surface temperature is measured in different units, but the values have been plotted alongside the PDI to show how they compare. The lines have been smoothed using a five-year weighted average, plotted at the middle year. The most recent average (2011–2015) is plotted at 2013. Data source: Emanuel, K.A. 2016 update to data originally published in: Emanuel, K.A. 2007. Environmental factors affecting tropical cyclone power dissipation. J. Climate 20(22):5497–5509. |
| 日期 | |
| 來源 | https://www.epa.gov/climate-indicators/climate-change-indicators-tropical-cyclone-activity#6 |
| 作者 | EPA/NOAA |
授權條款
[編輯]
本圖像屬於公有領域,因該作品最初來自於美國國家海洋和大氣管理局職員的職務作品。
|
檔案歷史
點選日期/時間以檢視該時間的檔案版本。
| 日期/時間 | 縮圖 | 尺寸 | 用戶 | 備註 | |
|---|---|---|---|---|---|
| 目前 | 2022年9月2日 (五) 11:43 | | 928 × 580(65 KB) | Adakiko(對話 | 貢獻) | Current power disipation plotted to 2017 |
| 2022年9月2日 (五) 11:35 |  | 928 × 580(83 KB) | Adakiko(對話 | 貢獻) | Current 1880 to 2021 | |
| 2017年10月8日 (日) 14:51 |  | 928 × 580(67 KB) | Prokaryotes(對話 | 貢獻) | User created page with UploadWizard |
無法覆蓋此檔案。
檔案用途
沒有使用此檔案的頁面。
全域檔案使用狀況
以下其他 wiki 使用了這個檔案:
- bn.wikipedia.org 的使用狀況
- en.wikipedia.org 的使用狀況
- ko.wikipedia.org 的使用狀況
- zh.wikipedia.org 的使用狀況