File:Ocean heat anomaly map 2020.jpg
跳转到导航
跳转到搜索

本预览的尺寸:700 × 600像素。 其他分辨率:280 × 240像素 | 560 × 480像素 | 896 × 768像素 | 1,195 × 1,024像素 | 1,400 × 1,200像素。
原始文件 (1,400 × 1,200像素,文件大小:465 KB,MIME类型:image/jpeg)
说明
说明
添加一行文字以描述该文件所表现的内容
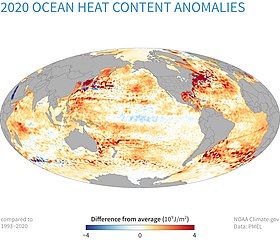
Year 2020 map of ocean heat anomaly in the upper 700 meters
摘要
[编辑]
| 描述 |
English: Map shows ocean heat anomalies in the upper 700 meters for year 2020 relative to average heat content during years 1993 thru 2020 of the same ocean regions. Regions shown in red (blue) gained (lost) thermal energy in 2020. Most regions showed positive anomalies and the total ocean heat content reached a record-high value in 2020. Image from: Reporting on the State of the Climate in 2020 published September 1, 2020 by Jessica Blunden (NOAA Climate.gov) |
| 日期 | |
| 来源 | https://www.climate.gov/media/13226 |
| 作者 | NOAA Climate.gov |
许可协议
[编辑]
本图像属于公有领域,因该作品最初来自于美国国家海洋和大气管理局职员的职务作品。
|
文件历史
点击某个日期/时间查看对应时刻的文件。
| 日期/时间 | 缩略图 | 大小 | 用户 | 备注 | |
|---|---|---|---|---|---|
| 当前 | 2022年1月7日 (五) 04:42 | | 1,400 × 1,200(465 KB) | Bikesrcool(留言 | 贡献) | Uploaded a work by NOAA Climate.gov from https://www.climate.gov/media/13226 with UploadWizard |
您不可以覆盖此文件。
文件用途
没有页面使用本文件。
全域文件用途
以下其他wiki使用此文件:
- en.wikipedia.org上的用途
- ig.wikipedia.org上的用途
- mk.wikipedia.org上的用途
- zh.wikipedia.org上的用途