File:Oil Balance Thailand.svg
Перейти к навигации
Перейти к поиску

Размер этого PNG-превью для исходного SVG-файла: 800 × 431 пкс. Другие разрешения: 320 × 172 пкс | 640 × 345 пкс | 1024 × 551 пкс | 1280 × 689 пкс | 2560 × 1378 пкс | 1170 × 630 пкс.
Исходный файл (SVG-файл, номинально 1170 × 630 пкс, размер файла: 82 КБ)
Краткие подписи
Краткие подписи
Добавьте однострочное описание того, что собой представляет этот файл
Краткое описание[править]
| Описание |
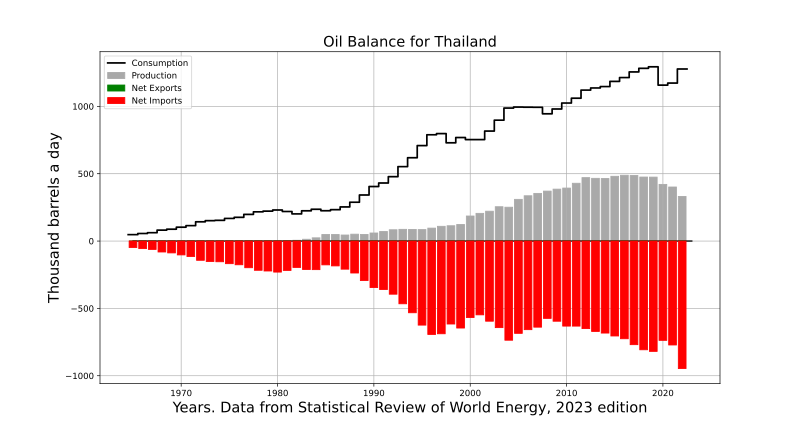
English: Oil balance for this country. This is meant to supersede old "ELM" graphs uploaded in 2008 by Jonathan Callahan , that are out-of-date, non-vectorial and of dubious license.
The data are from BP statistical report. note that imports or exports are approximated using the difference between production and consumption. This is a good approximation, but not 100% accurate because some countries can import and export petroleum in the same time, and it ignores refinery gains and stock changes. The graphs are generated automagically from BP's excel file using a PYTHON script. It can be found here for future updated. |
| Дата | |
| Источник | Собственная работа |
| Автор | Raminagrobis |
Лицензирование[править]
Я, владелец авторских прав на это произведение, добровольно публикую его на условиях следующей лицензии:
Этот файл доступен по лицензии Creative Commons Attribution-Share Alike 4.0 International
- Вы можете свободно:
- делиться произведением – копировать, распространять и передавать данное произведение
- создавать производные – переделывать данное произведение
- При соблюдении следующих условий:
- атрибуция – Вы должны указать авторство, предоставить ссылку на лицензию и указать, внёс ли автор какие-либо изменения. Это можно сделать любым разумным способом, но не создавая впечатление, что лицензиат поддерживает вас или использование вами данного произведения.
- распространение на тех же условиях – Если вы изменяете, преобразуете или создаёте иное произведение на основе данного, то обязаны использовать лицензию исходного произведения или лицензию, совместимую с исходной.
История файла
Нажмите на дату/время, чтобы увидеть версию файла от того времени.
| Дата/время | Миниатюра | Размеры | Участник | Примечание | |
|---|---|---|---|---|---|
| текущий | 19:37, 30 ноября 2023 | | 1170 × 630 (82 КБ) | Raminagrobis (обсуждение | вклад) | {{Information |description={{en|1=Oil balance for Thailand. This is meant to supersede old "ELM" graphs uploaded in 2008 by Jonathan Callahan , that are out-of-date, non-vectorial and of dubious license. The data are from BP statistical report (2023 Edition). note that imports or exports are approximated using the difference between production and consumption. This is a good approximation, but not 100% accurate because some countries can import and export petroleum in the same t... |
| 16:14, 26 ноября 2023 |  | 990 × 540 (77 КБ) | Raminagrobis (обсуждение | вклад) | {{Information |description={{en|1=Oil balance for Thailand. This is meant to supersede old "ELM" graphs uploaded in 2008 by Jonathan Callahan , that are out-of-date, non-vectorial and of dubious license. The data are from BP statistical report (2021 Edition). note that imports or exports are approximated using the difference between production and consumption. This is a good approximation, but not 100% accurate because some countries can import and export petroleum in the same t... | |
| 19:31, 1 августа 2022 |  | 990 × 540 (74 КБ) | Raminagrobis (обсуждение | вклад) | {{Information |description={{en|1=Oil balance for Thailand. This is meant to supersede old "ELM" graphs uploaded in 2008 by Jonathan Callahan , that are out-of-date, non-vectorial and of dubious license. The data are from BP statistical report (2021 Edition). note that imports or exports are approximated using the difference between production and consumption. This is a good approximation, but not 100% accurate because some countries can import and export petroleum in the same t... | |
| 19:52, 11 сентября 2021 |  | 990 × 540 (74 КБ) | Raminagrobis (обсуждение | вклад) | =={int:filedesc}== {Information |description={en|1=Oil balance for this country. This is meant to supersede old "ELM" graphs uploaded in 2008 by Jonathan Callahan , that are out-of-date, non-vectorial and of dubious license. The data are from BP statistical report. note that imports or exports are approximated using the difference between production and consumption. This is a good approximation, but not 100% accurate because some countries can import and export petroleum in... | |
| 19:04, 25 июня 2020 |  | 576 × 432 (77 КБ) | Raminagrobis (обсуждение | вклад) | Annual update 2020. Data from BP stat report. Generated using python | |
| 16:42, 24 июня 2017 |  | 720 × 540 (80 КБ) | Raminagrobis (обсуждение | вклад) | annual update 2017 | |
| 18:21, 4 ноября 2016 |  | 720 × 540 (79 КБ) | Raminagrobis (обсуждение | вклад) | fixed spelling, added black line, added "(oil)" in the title | |
| 18:49, 3 ноября 2016 |  | 720 × 540 (77 КБ) | Raminagrobis (обсуждение | вклад) | User created page with UploadWizard |
Вы не можете перезаписать этот файл.
Использование файла
Нет страниц, использующих этот файл.
Глобальное использование файла
Данный файл используется в следующих вики:
- Использование в ar.wikipedia.org
- Использование в en.wikipedia.org
- Использование в fr.wikipedia.org
- Использование в id.wikipedia.org
- Использование в ru.wikipedia.org
- Использование в vi.wikipedia.org
- Использование в www.wikidata.org