File:Oxygenation-atm-2.svg
跳转到导航
跳转到搜索

此SVG文件的PNG预览的大小:800 × 390像素。 其他分辨率:320 × 156像素 | 640 × 312像素 | 1,024 × 500像素 | 1,280 × 625像素 | 2,560 × 1,250像素 | 840 × 410像素。
原始文件 (SVG文件,尺寸为840 × 410像素,文件大小:40 KB)
说明
说明
添加一行文字以描述该文件所表现的内容
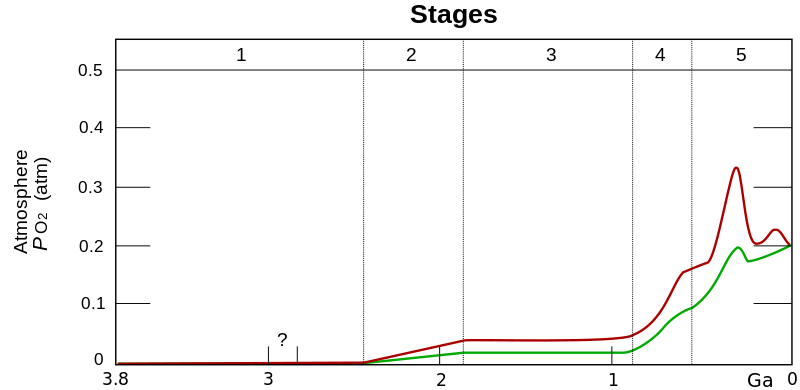
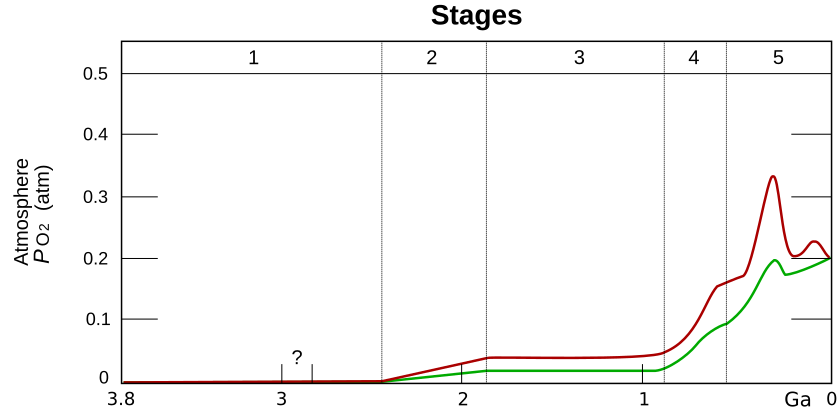
Estimated evolution of atmospheric PO2
摘要
[编辑]| 描述 |
English: Estimated evolution of atmospheric . The upper red and lower green lines represent the range of the estimates. The stages are: stage 1 (3.85–2.45Gyr ago (Ga)), stage 2 (2.45–1.85Ga), stage 3 (1.85–0.85Ga), Stage 4 (0.85–0.54Ga )and stage 5 (0.54Ga–present) . |
| 日期 | (UTC) |
| 来源 | |
| 作者 |
|
| 其他版本 |
[]
.png:
.jpg:
|


| 这是一张修改过的图片,这意味着它已在原版本的基础上通过软件进行了编辑,改动内容:Time scale。其原始版本为:Oxygenation-atm.svg。修改者:Loudubewe。
|
许可协议
[编辑]
我,本作品著作权人,特此采用以下许可协议发表本作品:
| 本文件采用知识共享署名-相同方式共享 3.0 未本地化版本许可协议授权。 | ||
| ||
| 本许可协议标签作为GFDL许可协议更新的组成部分被添加至本文件。 |

|
已授权您依据自由软件基金会发行的无固定段落及封面封底文字(Invariant Sections, Front-Cover Texts, and Back-Cover Texts)的GNU自由文件许可协议1.2版或任意后续版本的条款,复制、传播和/或修改本文件。该协议的副本请见“GNU Free Documentation License”。 |
您可以选择您需要的许可协议。
原始上传日志
[编辑]
This image is a derivative work of the following images:
- File:Oxygenation-atm.svg licensed with Cc-by-sa-3.0-migrated, GFDL
- 2009-01-02T05:19:53Z TiCPU 840x410 (22026 Bytes) {{Information |Description={{en|1=Estimated evolution of atmospheric \ P_{{O_{{2}}}} and the concentration of O2 in the shallow and deep oceans. The stages are: stage 1 (3.85–2.45Gyr ago (Ga)), stage 2 (2.45–1.85Ga), stag
Uploaded with derivativeFX
文件历史
点击某个日期/时间查看对应时刻的文件。
| 日期/时间 | 缩略图 | 大小 | 用户 | 备注 | |
|---|---|---|---|---|---|
| 当前 | 2024年2月14日 (三) 13:07 | | 840 × 410(40 KB) | Alfa-ketosav(留言 | 贡献) | File uploaded using svgtranslate tool (https://svgtranslate.toolforge.org/). Added translation for hu. |
| 2022年11月12日 (六) 19:22 |  | 840 × 410(29 KB) | Hugo(留言 | 贡献) | File uploaded using svgtranslate tool (https://svgtranslate.toolforge.org/). Added translation for cs. | |
| 2011年1月22日 (六) 16:34 |  | 840 × 410(24 KB) | Loudubewe(留言 | 贡献) | removing of false graph legend | |
| 2011年1月22日 (六) 16:13 |  | 840 × 410(25 KB) | Loudubewe(留言 | 贡献) | {{Information |Description={{en|1=Estimated evolution of atmospheric <math> P_{{O_{{2}}}}</math> in the shallow (red line) and deep (green line) oceans. The stages are: stage 1 (3.85–2.45Gyr ago (Ga)), stage 2 (2.45–1.85Ga), stage 3 (1.85–0.85Ga), S |
您不可以覆盖此文件。
文件用途
以下15个页面使用本文件:
- File:Evolution Of Atmospheric Oxygen.svg
- File:Oksijenasyon-atm-tr.svg
- File:Oxichenación-atm.svg
- File:Oxygenation-atm-2.svg
- File:Oxygenation-atm-es.svg
- File:Oxygenation-atm-ru.svg
- File:Oxygenation-atm.png
- File:Oxygenation-atm.svg
- File:Oxygenation-atm - Ar.png
- File:Oxygenation-atm ja.svg
- File:Oxygenation.jpg
- File:Oxygenation.svg
- File:Oxygénation de l'atmosphère.svg
- Template:Other versions/Oxygenation-atm
- Category:Great Oxidation Event
全域文件用途
以下其他wiki使用此文件:
- af.wikipedia.org上的用途
- ar.wikipedia.org上的用途
- az.wikipedia.org上的用途
- bn.wikipedia.org上的用途
- ca.wikipedia.org上的用途
- cs.wikipedia.org上的用途
- da.wikipedia.org上的用途
- de.wikipedia.org上的用途
- en.wikipedia.org上的用途
- es.wikipedia.org上的用途
- et.wikipedia.org上的用途
- fr.wikipedia.org上的用途
- gl.wikipedia.org上的用途
- hu.wikipedia.org上的用途
- id.wikipedia.org上的用途
- ko.wikipedia.org上的用途
- ms.wikipedia.org上的用途
- nl.wikipedia.org上的用途
- pt.wikipedia.org上的用途
- simple.wikipedia.org上的用途
- si.wikipedia.org上的用途
- test.wikipedia.org上的用途
- te.wikipedia.org上的用途
- tl.wikipedia.org上的用途
- uk.wikipedia.org上的用途
- vi.wikipedia.org上的用途
- www.wikidata.org上的用途
- zh.wikipedia.org上的用途