File:Percentage of population served by different types of sanitation systems.png
跳转到导航
跳转到搜索
没有更高的分辨率。
Percentage_of_population_served_by_different_types_of_sanitation_systems.png (780 × 535像素,文件大小:145 KB,MIME类型:image/png)
说明
说明
添加一行文字以描述该文件所表现的内容
摘要
[编辑]
| 描述 |
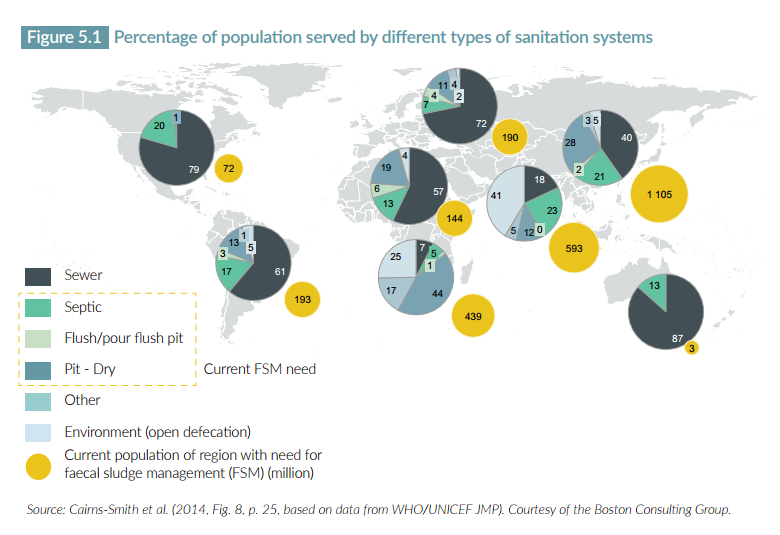
English: Figure 5.1 Percentage of population served by different types of sanitation systems |
| 日期 | |
| 来源 | http://www.unwater.org/publications/publications-detail/en/c/853650/ |
| 作者 | UN Water |
许可协议
[编辑]
本文件采用知识共享署名-相同方式共享 4.0 国际许可协议授权。
- 您可以自由地:
- 共享 – 复制、发行并传播本作品
- 修改 – 改编作品
- 惟须遵守下列条件:
- 署名 – 您必须对作品进行署名,提供授权条款的链接,并说明是否对原始内容进行了更改。您可以用任何合理的方式来署名,但不得以任何方式表明许可人认可您或您的使用。
- 相同方式共享 – 如果您再混合、转换或者基于本作品进行创作,您必须以与原先许可协议相同或相兼容的许可协议分发您贡献的作品。
文件历史
点击某个日期/时间查看对应时刻的文件。
| 日期/时间 | 缩略图 | 大小 | 用户 | 备注 | |
|---|---|---|---|---|---|
| 当前 | 2017年5月17日 (三) 14:30 | | 780 × 535(145 KB) | EMsmile(留言 | 贡献) | User created page with UploadWizard |
您不可以覆盖此文件。
文件用途
没有页面使用本文件。
全域文件用途
以下其他wiki使用此文件:
- bn.wikipedia.org上的用途
- en.wikipedia.org上的用途
- zh.wikipedia.org上的用途