File:Projections of global mean sea level rise by Parris et al. (2012).png
跳转到导航
跳转到搜索

本预览的尺寸:800 × 449像素。 其他分辨率:320 × 180像素 | 640 × 359像素 | 1,355 × 761像素。
原始文件 (1,355 × 761像素,文件大小:34 KB,MIME类型:image/png)
说明
说明
添加一行文字以描述该文件所表现的内容
摘要[编辑]
.png&action=edit§ion=1)
| 描述 |
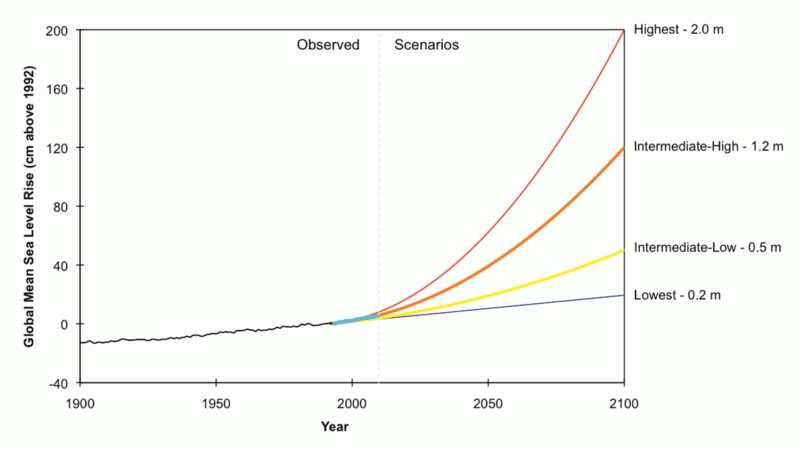
English: This graph shows projections of global mean sea level rise (SLR) by Parris et al. (2012)[1] In 2100, global mean sea level is projected to rise by 0.2-2.0 m (0.7-6.6 ft), relative to mean sea level in 1992:
Scenario / SLR by 2100 (m) / SLR by 2100 (ft) Note: projections are relative to mean sea level in 1992. SLR increases smoothly over the 21st century, with a slight acceleration over time. In 2050, SLR projections approximately range between 0.1-0.62 m (0.3-2.0 ft). Parris et al. (2012)[2] do not assign probabilities to these scenarios. Therefore, none of these scenarios should be interpreted as a best-estimate of future SLR. Notes
References
|
| 日期 | |
| 来源 | Figure 10, in: "4. Global Mean Sea Level Rise Scenarios," in: "Main Report," in: Global Sea Level Rise Scenarios for the US National Climate Assessment. NOAA Tech Memo OAR CPO-1[2], National Oceanic and Atmospheric Administration Climate Program Office, 6 December 2012, p.12. |
| 作者 | Parris, A., P. Bromirski, V. Burkett, D. Cayan, M. Culver, J. Hall, R. Horton, K. Knuuti, R. Moss, J. Obeysekera, A. Sallenger, and J. Weiss |
许可协议[编辑]
.png&action=edit§ion=2)
本图像属于公有领域,因该作品最初来自于美国国家海洋和大气管理局职员的职务作品。
|
文件历史
点击某个日期/时间查看对应时刻的文件。
| 日期/时间 | 缩略图 | 大小 | 用户 | 备注 | |
|---|---|---|---|---|---|
| 当前 | 2013年8月17日 (六) 12:03 | | 1,355 × 761(34 KB) | Enescot(留言 | 贡献) | {{Information |Description ={{en|1=This graph shows projections of global mean sea level rise (SLR) by Parris ''et al.'' (2012)<ref> Figure 10, in: 4. Global Mean Sea Level Rise Scenarios, in: Main Report, in {{harvnb|... |
您不可以覆盖此文件。
文件用途
-es.png)
全域文件用途
以下其他wiki使用此文件:
- en.wikipedia.org上的用途
- es.wikipedia.org上的用途
- uk.wikipedia.org上的用途
.png&oldid=730920007)