File:Quasiconvex function.png
跳至導覽
跳至搜尋
無更高解析度可提供。
Quasiconvex_function.png (501 × 358 像素,檔案大小:11 KB,MIME 類型:image/png)
說明
說明
添加單行說明來描述出檔案所代表的內容
摘要
[編輯]

|
本圖片是以PNG、GIF或JPEG格式上傳。然而,其中包含的資料或訊息,應該重新建立成可縮放向量圖形(SVG)檔案,以更有效率或更準確的方式儲存。如有可能,請上傳本圖片的SVG格式版本。在上傳之後,請修改維基各姊妹計畫中所有使用舊版圖片的條目(列在圖像連結章節中),替換為新版圖片,並在舊圖片的描述頁中加入{{Vector version available|新圖片名稱.svg}}模板,同時移除本模板。
|
| 描述 |
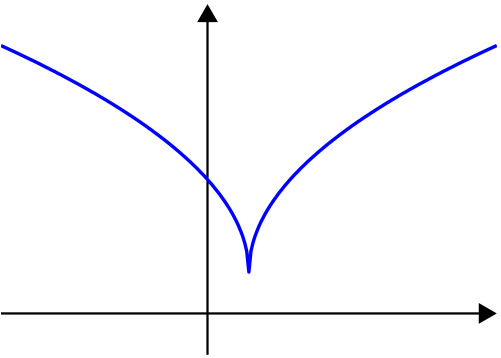
English: Quasiconvex function |
| 來源 | 自己的作品, created by myself with MATLAB. |
| 作者 | user:Oleg Alexandrov |
授權條款
[編輯]
| 我,此作品的版權所有人,釋出此作品至公共領域。此授權條款在全世界均適用。 這可能在某些國家不合法,如果是的話: 我授予任何人有權利使用此作品於任何用途,除受法律約束外,不受任何限制。 |
function main()

% prepare the scrreen and define some parameters
clf; hold on; axis equal; axis off;
fontsize=25; thick_line=3; thin_line=2; black=[0, 0, 0]; red=[1, 0, 0];
arrowsize=0.1; arrow_type=1; arrow_angle=30; % (angle in degrees)

L=1;

X=(-L):0.01:(L+0.4);
Y=sqrt(abs(X-0.2))+0.2;

arrow([-L 0], [L+0.4, 0],          thin_line, arrowsize, arrow_angle, arrow_type, black)
arrow([0 min(Y)-0.4], [0 max(Y)+0.2], thin_line, arrowsize, arrow_angle, arrow_type, black)
plot(X, Y, 'linewidth', thick_line)

saveas(gcf, 'Quasiconvex_function.eps', 'psc2') % export to eps


function arrow(start, stop, thickness, arrow_size, sharpness, arrow_type, color)

% Function arguments:
% start, stop:  start and end coordinates of arrow, vectors of size 2
% thickness:    thickness of arrow stick
% arrow_size:   the size of the two sides of the angle in this picture ->
% sharpness:    angle between the arrow stick and arrow side, in degrees
% arrow_type:   1 for filled arrow, otherwise the arrow will be just two segments
% color:        arrow color, a vector of length three with values in [0, 1]

% convert to complex numbers
   i=sqrt(-1);
   start=start(1)+i*start(2); stop=stop(1)+i*stop(2);
   rotate_angle=exp(i*pi*sharpness/180);

% points making up the arrow tip (besides the "stop" point)
   point1 = stop - (arrow_size*rotate_angle)*(stop-start)/abs(stop-start);
   point2 = stop - (arrow_size/rotate_angle)*(stop-start)/abs(stop-start);

   if arrow_type==1 % filled arrow

      % plot the stick, but not till the end, looks bad
      t=0.5*arrow_size*cos(pi*sharpness/180)/abs(stop-start); stop1=t*start+(1-t)*stop;
      plot(real([start, stop1]), imag([start, stop1]), 'LineWidth', thickness, 'Color', color);

      % fill the arrow
      H=fill(real([stop, point1, point2]), imag([stop, point1, point2]), color);
      set(H, 'EdgeColor', 'none')

   else % two-segment arrow
      plot(real([start, stop]), imag([start, stop]),   'LineWidth', thickness, 'Color', color);
      plot(real([stop, point1]), imag([stop, point1]), 'LineWidth', thickness, 'Color', color);
      plot(real([stop, point2]), imag([stop, point2]), 'LineWidth', thickness, 'Color', color);
   end
|
|
本圖片是以PNG、GIF或JPEG格式上傳。然而,其中包含的資料或訊息,應該重新建立成可縮放向量圖形(SVG)檔案,以更有效率或更準確的方式儲存。如有可能,請上傳本圖片的SVG格式版本。在上傳之後,請修改維基各姊妹計畫中所有使用舊版圖片的條目(列在圖像連結章節中),替換為新版圖片,並在舊圖片的描述頁中加入{{Vector version available|新圖片名稱.svg}}模板,同時移除本模板。
|
檔案歷史
點選日期/時間以檢視該時間的檔案版本。
| 日期/時間 | 縮圖 | 尺寸 | 使用者 | 備註 | |
|---|---|---|---|---|---|
| 目前 | 2007年1月27日 (六) 19:33 | | 501 × 358(11 KB) | Oleg Alexandrov(留言 | 貢獻) | Created by myself with MATLAB. |
無法覆蓋此檔案。
檔案用途
沒有使用此檔案的頁面。
全域檔案使用狀況
以下其他 wiki 使用了這個檔案:
- de.wikipedia.org 的使用狀況
- en.wikipedia.org 的使用狀況
- fa.wikipedia.org 的使用狀況
- fr.wikipedia.org 的使用狀況
- jbo.wikipedia.org 的使用狀況
- pt.wikipedia.org 的使用狀況
- ru.wikipedia.org 的使用狀況
- uk.wikipedia.org 的使用狀況
- zh.wikipedia.org 的使用狀況